How to Measure Training Effectiveness in an Organization

To truly measure training effectiveness, you have to look past simple satisfaction surveys. The real goal is to systematically track how learning translates into on-the-job behavior and, ultimately, tangible business outcomes. This means evaluating knowledge retention, observing skill application, and connecting your training directly to key performance indicators like productivity or revenue.
Jump To Section

Earn As You Learn
Earn 25% commission when your network purchase Uplyrn courses or subscribe to our annual membership. It’s the best thing ever. Next to learning,
of course.
Moving Beyond Happy Sheets to Prove Real Value
Let's be honest, proving the value of training often feels like an uphill battle. We've all used 'happy sheets'—those simple satisfaction surveys handed out right after a session—but deep down, we know they don't tell the whole story.
A happy learner doesn't always equal a more skilled employee or a better business outcome. While knowing your team enjoyed a program is nice, it’s a surface-level metric. To get to the truth, you need a much deeper, more strategic approach.
This guide is for Learning and Development (L&D) professionals who are ready to build a robust measurement strategy. The mission is to connect training directly to performance improvements and the company's biggest goals. It’s about shifting the conversation from, "Did they like it?" to "Did it move the needle?"
The Path to Meaningful Measurement
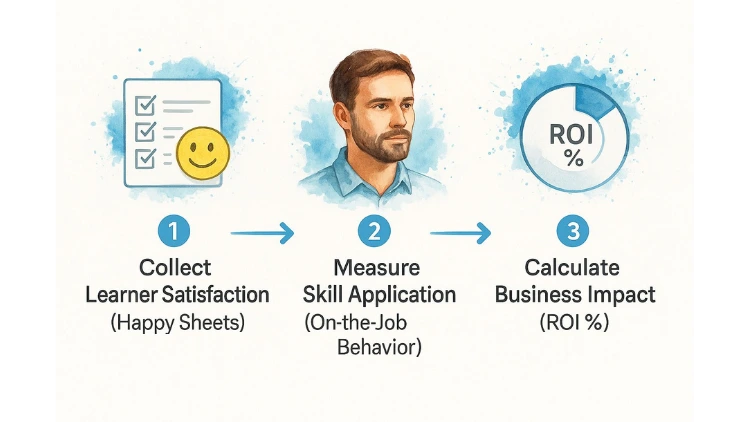
To truly understand the impact of your work, you need a multi-layered approach that follows the entire learning journey. The process isn't a single step; it's an evolution from gathering basic feedback to calculating real business impact.
As you can see, learner satisfaction is just the starting point. The real win is connecting training investments to quantifiable business impact and return on investment (ROI). Making that progression is how you demonstrate undeniable value to stakeholders.
The real challenge isn't just collecting data; it's connecting the dots between what happens in a training session and what happens on the job. Without this link, training remains a cost center instead of a strategic driver of growth.
Why a Structured Approach Matters
When you adopt a structured evaluation framework, you're doing more than just creating a report card for your programs. You're building a strategic tool. With solid data in hand, you can:
- Optimize Your Budget
- Actionable Insight: If your data shows a blended learning program (mixing online modules with live workshops) has double the ROI of a workshop-only model, you can confidently reallocate funds for the next quarter. Justify L&D spending with clear evidence of its impact on the bottom line.
- Refine Your Programs
- Practical Example: Feedback might reveal that while your new sales training content is excellent, reps struggle to apply it because they can't find key resources later. Your actionable insight is to create a one-page "cheat sheet" they can access on their phones. Pinpoint what’s working and what isn’t, allowing you to iterate and improve content for better results.
- Demonstrate True Impact: Finally show stakeholders how your work contributes to organizational success in a language they understand—results.
Measuring training effectively isn't just about accountability. It’s about making your L&D function more agile and responsive to the real needs of the business.
For those looking to see how this plays out in a modern workplace, it's worth learning more about how to bridge the gap between virtual training and organizational impact. This is a critical step in turning theoretical knowledge from any training program into practical, on-the-ground application.
Choosing Your Evaluation Framework
To really measure if your training works, you can't just throw a survey out there and hope for the best. You need a structured plan, a blueprint that tells you what to measure, how to measure it, and why any of it even matters.
Think of it this way: without a framework, you're just taking a random snapshot. With one, you're creating a time-lapse video that shows the entire story of how your training created change over time.
A good framework is your defense against drowning in useless data. It’s what helps you systematically connect your training initiatives to actual business results. The best place to start? The Kirkpatrick Model. It's the gold standard for a reason.
Decoding the Kirkpatrick Model’s Four Levels
Don Kirkpatrick developed this model back in 1959, and it's still the go-to for 52% of large organizations across North America and Europe. Why? Because it’s intuitive, comprehensive, and just plain works. It breaks evaluation into four clear levels, each one building on the last.
The biggest mistake we see people make is stopping too soon. Most organizations nail Levels 1 and 2 but then give up before connecting training to the outcomes that really matter at Levels 3 and 4. In fact, a shocking 33% of organizations globally don't even try to measure the financial impact of their training.
Let's walk through each level with some real-world examples so you don't fall into that trap.
Level 1: Reaction — How Did They Feel?
This is all about gauging how participants felt about the training. It's easy to dismiss these as simple "happy sheets" but this immediate feedback is gold for spotting problems with the content, the instructor, or even the room temperature.
- Practical Example: After a cybersecurity workshop, don't just ask, "Did you like the session?" on a 1-5 scale. That's lazy. Ask something that makes them think: "What is the one thing you'll do differently tomorrow to protect our data?" This gives you an action-oriented response, not just a number.
- Actionable Insight: Use a sentiment analysis tool to scan the open-ended feedback. Software can instantly pick up on common themes like "engaging instructor" or "technical issues", giving you rich qualitative data without spending hours reading every single comment.
Level 2: Learning — What Did They Actually Learn?
Okay, they liked it. But did they learn anything? This level is where you prove that knowledge was actually transferred. We're moving beyond feelings and into measurable skill acquisition.
- Practical Example: Before rolling out new software, give everyone a quick 10-question pre-assessment to see what they already know. After the training, give them a post-assessment with similar (but not identical) questions. The improvement in their scores is your learning gain, clear as day.
- Actionable Insight: Ditch the boring multiple-choice questions. Test for application. Try a scenario-based question like, "A customer reports X issue. Based on the training, what are the first three steps you'd take?" This shows if they can apply the knowledge, not just memorize it. This guide on the best way to use the Kirkpatrick Model for evaluating L&D impact has more ideas like this.
Level 3: Behavior — Are They Applying It on the Job?
This is the make-or-break level. Did the skills they learned in the classroom actually make it into their day-to-day work? This isn't about what happens during training week; it's about what happens three months later.
- Practical Example: Let's say you ran a sales training program on consultative selling. You can track a key behavior right in your CRM. Are your reps asking more discovery questions per call? If that number jumps, you know the training is sticking.
- Actionable Insight: Use a 360-degree feedback process. Before the training and again 90 days after, ask the employee, their manager, and a coworker to rate them on a specific skill, like "Provides constructive feedback effectively". Getting multiple perspectives gives you a much more accurate picture of behavioral change.
Level 4: Results — What Was the Business Impact?
We've finally arrived at the holy grail. This is where you connect the training directly to tangible business outcomes. It answers the one question every stakeholder really cares about: "Was this worth the investment?"
- Practical Example: A manufacturing plant rolls out a new safety training program. The "Result" isn't just a certificate of completion; it's a 15% drop in workplace accidents over the next six months, which also leads to lower insurance premiums. That's a result you can take to the bank.
- Actionable Insight: You have to isolate the training's impact. If sales went up 10% after a training program, you can't just give the training all the credit. You need to control for other factors. Compare the trained group to a control group that didn't get the training, or analyze performance trends before and after the program while accounting for things like seasonal demand.
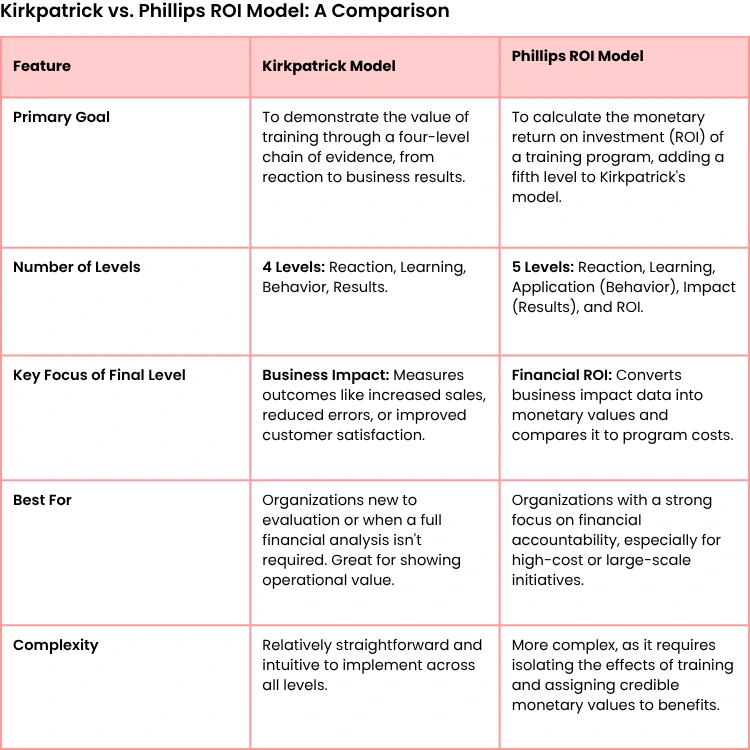
Adding a Financial Lens with the Phillips ROI Model
While Kirkpatrick’s Level 4 is great for measuring business impact, the Phillips ROI Model takes it one step further by adding a fifth level: Return on Investment (ROI). This model is designed to answer the CFO's favorite question: "For every dollar we spent, how many did we get back?"
It uses the same first four levels as Kirkpatrick but adds that critical financial calculation at the end. The formula itself is pretty straightforward:
ROI (%) = (Net Program Benefits / Total Program Costs) x 100
To get there, you have to put a dollar value on your Level 4 results. For example, if a time management course for project managers leads to a 5% reduction in project completion time, you can calculate the monetary value of that saved time (that's your Net Program Benefits). Then, you divide that by all the costs—instructor fees, materials, and even the cost of employees' time away from their desks.
Below is a quick comparison to help you decide which model fits your needs.
A positive ROI is definitive proof that your training wasn't just another expense—it was a strategic investment that generated real value.
By choosing a solid framework like Kirkpatrick or Phillips, you're not just collecting data. You're building a clear, defensible story about how your L&D efforts are pushing the entire business forward.
Collecting the Right Data at Every Level
An evaluation framework gives you a map, but the right data is the fuel that powers your journey. Without a smart data collection strategy, even the best models are just theoretical exercises. To truly get a handle on training effectiveness, you need to gather the right information at each stage, blending different sources to create a complete picture.
This is about more than just sending out a survey. It’s about being intentional, timely, and even a bit creative with how you capture insights. The goal is to collect a mix of quantitative (the numbers) and qualitative (the stories) data to build a credible, multi-dimensional view of your training's impact.
Let’s get practical and break down data collection methods for each level.
Capturing Instant Reactions
The first level, Reaction, is your immediate gut check on the learning experience. Traditional end-of-course "happy sheets" are a start, but they often come too late to fix anything and can feel like an administrative afterthought. A better approach is to capture feedback in the moment.
- Practical Example: Instead of waiting, try using quick pulse surveys right in the middle of a virtual training. A simple poll asking, "On a scale of 1-5, how clear was that last module?" can give you real-time data to adjust your approach on the fly.
- Actionable Insight: Use a collaborative document or digital whiteboard where people can post questions and comments anonymously. This creates a psychologically safe space for honest feedback you might not otherwise get, especially on sensitive topics.
A common mistake is treating Reaction data as a simple pass/fail grade. The real value is in the trends. If 70% of participants in a virtual session rate the engagement as low, that's not on them—it’s a clear signal to rethink your delivery format.
Measuring True Learning and Knowledge Gain
For the Learning level, you need to prove that knowledge was actually transferred. This means moving beyond simple multiple-choice quizzes that just test memorization. The best assessments measure comprehension and the ability to apply new information.
Here are a few actionable methods that work:
- Project-Based Assessments
- Practical Example: Ask participants to complete a small project that mirrors a real-world task. For a project management course, you could have them create a mock project charter using the principles they just learned.
- Simulations: For technical or soft skills, simulations are invaluable. A sales team could run through a role-play with a difficult client, or an IT professional could troubleshoot a problem in a controlled virtual environment.
- Pre- and Post-Training Surveys: These are a classic for a reason. They provide a clear, quantitative measure of knowledge lift. For a deeper dive, this guide on crafting effective pre- and post-training survey questions provides a fantastic template to get you started.
The key is to design assessments that require people to synthesize and apply what they’ve learned, not just recall facts.
Observing On-the-Job Behavior Change
This is where the rubber meets the road. The Behavior level tracks whether the skills learned in training are actually being used back on the job. This data collection often happens weeks or months after the program ends and requires looking beyond the learner.
One of the most effective tools is a structured manager observation checklist.
- Actionable Insight: Give managers a simple checklist of 3-5 key behaviors they should look for in their team members post-training. This turns a subjective observation into a measurable data point.
For instance, after a communication skills workshop, a checklist item might be: "Employee uses the 'situation-behavior-impact' model when giving feedback."
You can also pull behavioral data directly from existing business systems.
- Practical Example: After training your customer service team on a new CRM feature, you can run a report to see if the usage of that specific feature increased by the target of 50% over the next 30 days. This provides hard, objective evidence of behavior change.
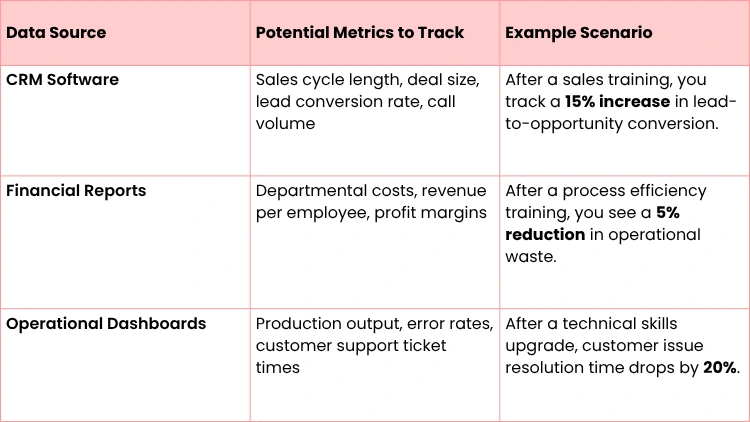
Connecting Training to Business Results
Finally, the Results level ties everything back to the business's bottom line. This requires you to step out of the L&D department and partner with other teams to access the right data. Your goal is to find a direct line between the behaviors you measured and the key performance indicators (KPIs) the business really cares about.
Think about the systems your company already uses to track success. The trick here is to establish a baseline before the training begins. You can't prove the training caused a change if you don't know where you started. By combining qualitative manager comments with hard quantitative data like sales figures, you build a powerful and convincing story of your training's impact.
How to Analyze Your Data and Calculate ROI
You've done the heavy lifting of gathering surveys, checking performance metrics, and collecting manager observations. Now you're staring at a mountain of data, and the big question is hanging in the air: what does it all mean? This is where the magic happens—where you turn raw numbers and feedback into a compelling story about your training's real-world value.
Honestly, moving from data collection to genuine insight is the most crucial part of this whole process. It’s not about just crunching numbers. It's about connecting the dots between what happened in the training room and what changed for the business. Without this step, your data is just a pile of isolated facts, not a narrative of impact.
It might feel a little overwhelming, but you can break it down into manageable chunks. First, you'll make sense of what you've got. Then, you'll calculate the financial return that really gets leadership’s attention.
Making Sense of Your Collected Data
Before you can calculate a single thing, you need to get your data organized and figure out what it's telling you. This means looking at both the qualitative feedback and the quantitative scores to spot emerging patterns.
- Actionable Insight: For the qualitative stuff—notes from focus groups or open-ended survey questions—your first job is coding. This just means grouping similar comments into themes. For instance, if a bunch of employees mention the "confusing user interface" in a software training survey, that becomes a key theme. It points you directly to a specific area that needs improvement.
- Practical Example: Quantitative data, like pre- and post-assessment scores, is a bit more straightforward. You can calculate the average improvement to find the "knowledge lift". Let's say the average score on a safety quiz was 55% before training and jumped to 88% after. That 33-point increase is a powerful, crystal-clear metric that shows learning happened.
The whole point of analysis is to find the "so what?" behind your data. An 88% post-assessment score is great, but knowing it represents a 33% leap from the baseline is what makes the impact undeniable for stakeholders.
A Practical Walkthrough Calculating Training ROI
Okay, now for the part that truly speaks the language of leadership: Return on Investment (ROI). We’ll use the Phillips ROI Model here, which brilliantly adds that crucial financial layer to the well-known Kirkpatrick framework.
Let's walk through a scenario we've seen play out in different forms over the years.
- Scenario: A tech company rolls out a six-month leadership development program for 20 mid-level managers. The big-picture goal? To reduce voluntary turnover on their teams, which is currently sitting at a painful 25% annually.
Here’s how you'd break down the ROI calculation.
Tally Up the Total Program Costs
First things first, you need to account for every single expense. And we mean every expense. It’s easy to miss the indirect costs, but they add up.
- Direct Costs:
- Facilitator fees: $50,000
- Course materials and platform licenses: $10,000
- Travel and lodging for a kickoff event: $15,000
- Indirect Costs:
- Manager salaries for time in training (20 managers x 40 hours x $75/hour): $60,000
- L&D team’s time for design and administration: $20,000
Total Program Cost: $155,000
Monetize the Program Benefits
Next up, you have to assign a dollar value to what the program achieved. In this case, the main goal was cutting down on turnover.
Let’s say the average cost to replace an employee on these teams—factoring in recruitment, onboarding, and lost productivity—is $20,000. Before the training, these 20 managers oversaw teams with a combined 200 employees and a 25% turnover rate. That means 50 employees were walking out the door each year, costing the company a cool $1,000,000.
After the program, you track turnover for the next 12 months. You find it’s dropped to 15%. Now, only 30 employees left. The training helped the company hang on to 20 people.
- Benefit Calculation: 20 employees retained x $20,000 cost per employee = $400,000 in savings.
Isolate the Effects of Training
This step is absolutely vital for your credibility. You can’t just claim the training was 100% responsible for the drop in turnover. Maybe the company introduced new benefits that year, or maybe the job market cooled off.
To isolate the training's effect, you could survey the managers and their direct reports, asking them to estimate how much of the improved retention they felt was due to the new leadership skills. Based on that feedback, you might conservatively attribute 60% of the improvement directly to the program.
- Isolated Benefit: $400,000 x 60% = $240,000
Calculate the Final ROI
You've got all the pieces. Now just plug them into the classic ROI formula:
- Net Program Benefits: $240,000 (Isolated Benefit) - $155,000 (Total Cost) = $85,000
- ROI (%) = (Net Benefits / Total Cost) x 100
- ROI (%) = ($85,000 / $155,000) x 100 = 54.8%
A 54.8% ROI is a number you can confidently walk into any boardroom with. It proves the program wasn't just another expense—it was a smart investment that paid for itself and then some.
Common Pitfalls to Avoid
Analysis is where a lot of well-intentioned efforts go off the rails. Globally, only about one-third of organizations formally track whether their training actually translates into measurable business results. It’s a huge gap. U.S. corporate training expenditure topped $90 billion in 2023, yet most companies simply don't have the systems to capture ROI effectively. Traditional tools often create data silos that can delay insights for weeks.
Keep an eye out for these common mistakes:
- Forgetting the Baseline: This one seems obvious, but it happens all the time. You can't show improvement if you don't have a clear picture of your starting point. Always measure your key metrics before the training kicks off.
- Ignoring Control Groups: When it's feasible, compare your trained group to a similar group that didn't go through the program. This is one of the most powerful ways to isolate the training's true impact.
- Overlooking Qualitative Data: Numbers are powerful, but stories are what people remember. A quote from a manager describing how the training transformed their team's dynamic can be just as impactful as any ROI percentage.
When it comes to the actual number-crunching, using powerful analytics features can give you the depth needed to see the full picture. By pairing a structured approach with the right tools, your analysis will be both airtight and incredibly persuasive.

Turning Measurement into Continuous Improvement
Measurement without action is just administration. After all the hard work of gathering and analyzing data, the most important part is using those insights to spark real, continuous improvement. This is the moment your evaluation efforts stop being a simple report card and become a dynamic tool for making your training programs smarter and more valuable.
The data you've gathered tells a story. Your job is to read between the lines and figure out what happens next. You’re hunting for the gaps between what you intended and what actually happened—the places where your program can be refined to get even better results. This isn't about finding fault; it's about finding opportunities.
Diagnosing the Learning Transfer Problem
One of the most common findings is also one of the most frustrating: learning scores are high, but on-the-job behavior hasn't budged. Employees aced the post-training quiz, but back at their desks, they’ve slipped right back into old habits.
This classic scenario points directly to a learning transfer problem. The knowledge made it into their heads, but it never made the leap into their daily workflow.
When you see this pattern, your data is signaling that the training content itself might be solid, but the support system around it is failing. Here are a few practical things you can do:
- Bring in Manager Coaching
- Actionable Insight: Give managers a simple checklist of key behaviors to look for and encourage after the training. This turns them into reinforcement partners on the ground.
- Deploy On-Demand Job Aids
- Practical Example: Create simple, one-page guides or short video tutorials that employees can pull up right when they need to apply a new skill, such as a PDF showing the five steps to handle a difficult customer.
- Schedule Follow-Up Sessions: A quick check-in a few weeks post-training can reignite learning and help employees troubleshoot real-world challenges they're facing.
By identifying what works, you can lean into those methods. For instance, good data might reveal that certain strategies to improve working memory are highly effective, helping you refine content so the learning actually sticks.
Tailoring Your Communication for Different Audiences
How you present your findings is just as important as the findings themselves. Different stakeholders need different information, and a one-size-fits-all report is guaranteed to fall flat. Your goal is to deliver the right insights to the right people in a way they can immediately understand and act upon.
Your job isn't just to report the data; it's to translate it. For executives, you're a business strategist showing ROI. For instructional designers, you're a collaborator pinpointing areas for refinement.
For Executives: They need the big picture, and they need it fast.
- Actionable Insight: Build a simple, visual dashboard that highlights top-level business impact and ROI. Focus on metrics like cost savings from reduced turnover or revenue growth from improved sales skills. Keep it high-level and tied directly to business goals.
For Instructional Designers: This is where you can get into the weeds. Give them detailed, specific feedback they can use to make the training better.
- Practical Example: Don't just say "the module was confusing". Instead, say, "Data shows 70% of participants struggled with the simulation in Module 3, suggesting we need clearer instructions or a simpler scenario."
This agile feedback loop is the engine that drives progress. Continuous, real-time feedback is essential, but so many organizations still rely on old-school methods. While 45% of L&D teams now use some form of analytics platform, many miss the chance to adapt by sticking only to post-course surveys.
Companies that use continuous feedback loops identify underperforming programs 28% faster, yet less than 20% of global organizations have actually adopted these systems. This highlights a huge opportunity to connect learning analytics with real business performance.
By turning measurement into an ongoing conversation, you shift from one-off evaluations toward a truly responsive learning culture. To learn more about building this system, check out this guide on how to create an ongoing learning cycle.
Your Top Questions About Measuring Training, Answered
Even with a solid framework, the real world throws curveballs. Let's tackle some of the most common questions we hear from L&D pros trying to get a real handle on training effectiveness.
How Can I Actually Measure Soft Skills Training?
This is the big one, right? Measuring something like leadership or communication can feel like trying to nail Jell-O to a wall. It’s not as straightforward as a technical skill with a clear pass/fail.
The trick is to stop thinking about the skill and start focusing on the observable behaviors that demonstrate it.
- Practical Example: Before anyone even steps into a classroom (virtual or otherwise), you need to define what success actually looks like on the job. For a communication workshop, that might mean a 15% reduction in customer support escalations or seeing more positive comments during 360-degree peer reviews. You can then use tools like pre- and post-training surveys to capture how managers, peers, and direct reports see those specific behaviors changing. This gives you a much richer, multi-dimensional picture of whether the training is actually sticking.
What Are the Biggest Mistakes to Avoid?
The single most common mistake we see is treating measurement as an afterthought. You absolutely cannot wait until a program is over to figure out how you’ll measure it. You have to define your success metrics and get a baseline reading before the training ever begins. Without that starting point, you’re just guessing.
Another major pitfall is putting all your eggs in one basket.
- Practical Example: A sky-high satisfaction score (Kirkpatrick Level 1) is great, but it’s a vanity metric if nobody actually learned anything (Level 2) or changed their behavior (Level 3). You need data from multiple sources to tell a convincing story.
Don’t just measure what’s easy—measure what matters. Relying solely on happy sheets is like judging a movie by its poster. It tells you nothing about the actual impact.
How Can a Small Business Measure Training with a Tight Budget?
You don’t need a six-figure software budget to get meaningful data. For a small business, some of the simplest tools are often the most powerful. It’s about being scrappy and strategic.
- Lean on free tools
- Practical Example: Google Forms is your best friend. It’s perfect for creating pre- and post-assessments, confidence ratings, and satisfaction surveys.
- Empower your managers
- Actionable Insight: Create simple observation checklists for managers to track key behavior changes on their teams. A manager’s direct observation is an incredibly valuable data point.
- Pick one key business metric: Don't try to boil the ocean. Tie the training to one important KPI that the business already cares about—like customer retention or sales cycle length—and track it religiously.
Effective measurement is about being resourceful, not about having the biggest budget.
At Uplyrn, we believe that effective learning leads to measurable growth. Our platform is designed to help individuals and teams acquire the skills they need to succeed, with built-in tools to track progress and demonstrate impact. Discover courses that drive real results.


Leave your thoughts here...
All Comments
Reply