Summarizing Projects and Understanding the Tracking Window

I often review P6 databases and I am horrified that they neither Summarize their database nor understand the importance of this function or understand the P6 functions that affect how Summarized data is calculated and where it is viewed.
Why Summarize Projects
When Projects are not Summarized then the information from unopened P6 projects seen in the Projects, Activities and Tracking windows will be blank when the project has never been Summarized or out of date if the project has been updated since it was last Summarized.
Aim
The aim of this paper is to explain what the author has found by experimentation:
- What Summarisation does;
- How to Summarize a project or project or a database;
- What functions affect the Summary data calculation, and
- Where Summarized data is viewed.
Summary
When a database is not Summarized and/or if users do not understand all the functions associated with Summarization then resource data read from unopened projects in views such as the Projects, Tracking and Activity windows will either be blank, or will be incorrect, or will not display data to the level required by users.
- The resource data in the Projects, Tracking and Activities windows of unopened projects is not the latest when a project has been updated after it was last Summarized or is zero when the project has never been Summarized.
- Summarization is best undertaken nightly using a Job Service.
- Summary resource spread data will NOT be available to the users when the User Preferences, Startup Filters, Resource Summary Data option is NOT checked.
- The Projects window, Setting tab, Summarized Data determines how many levels of the WBS is Summarized.
- The Admin Preferences, Options, Specify the interval to summarize and store resource spreads decides at what time interval that Summarized data is saved.
Jump To Section

Earn As You Learn
Earn 25% commission when your network purchase Uplyrn courses or subscribe to our annual membership. It’s the best thing ever. Next to learning,
of course.
Sample Data
The sample data used in this example has three projects with three WBS Nodes and three activities being assigned the one resource with a Units per Time period of 8 hours per day and an availability of 16 hours per day.
What summarisation does
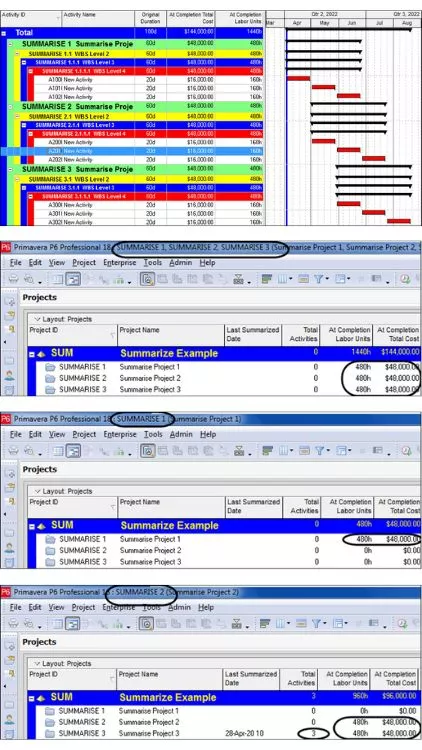
The resource data in the Activities window is not linked to the Projects window or Tracking window data, except when a project is open. Thus the data in the Projects and Tracking window of projects that have not been Summarized data is different when a project is open or closed.
The project resource data in the Projects window and Tracking window is read from a “Summary table” that is populated when either:
- A project has been Summarized, or
- A project is open.
When all three projects are open the Summary resource data is correct in the Projects window, but note the Total Activities (number of activities) is not Summarized.
When SUMMARIZE 1 project is open then only that project’s data is correct, the other two projects are now showing zero costs or resource data.
When SUMMARIZE 3 project is Summarized and SUMMARISE2 is open then only those two projects summary data is correct and SUMMARIZE 1 data is not correct.
NOTE: The project was Summarized on 28 April 2020, so now the Total Activities is correct but P6 shows an incorrect Last Summarized Date of 20 April 2010! This appears to be a glitch in the software.
How to Summarize a project or a database
Projects or a database are summarized in two ways:
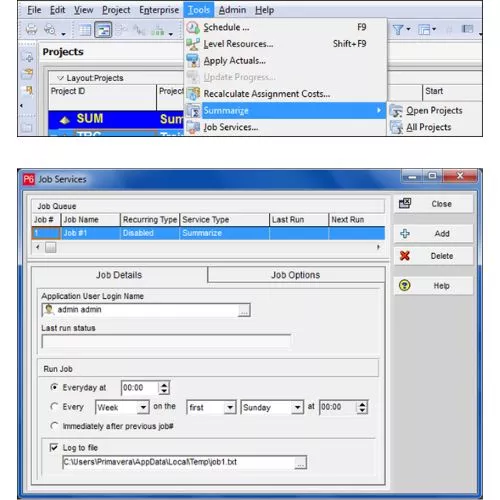
- Firstly, by selecting Tools, Summarize where you may Summarize either Open Projects or all All Projects.
- Secondly as a large database takes a significant amount of time to summarize and may be summarized automatically using Job Services and this is usually set to run every night.
The author recommends that every database is Summarized every night using a Job Services.
These topics are covered later in this paper:
- The Settings tab in the Project Window specifies to what level the data is summarized and indicates when it was last summarized, and
- The Admin Preferences, Options, Specify the interval to summarize and store resource spreads decides at what time interval that data is save in the Summary table.
User Preferences, Startup Filters, Resource Summary Data
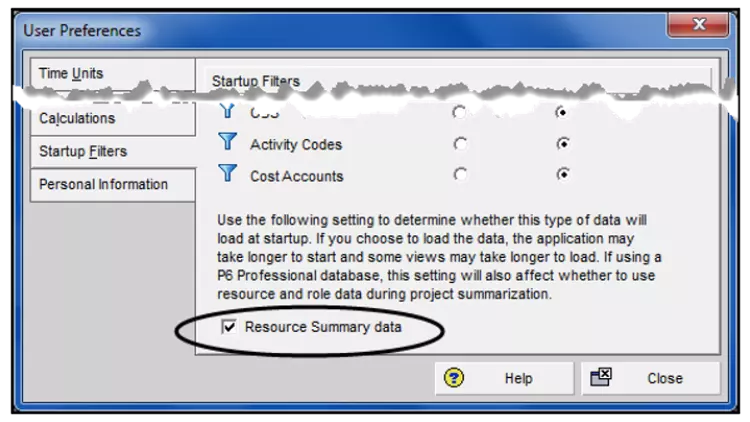
When the User Preferences, Startup Filters, Resource Summary Data option is NOT checked then the Summary table resources’ spread data is not loaded and resource spreads are not available in the Tracking window when this is not checked.
The software took a little longer to load as it is not loading summary data and the author's small database took 37 seconds to load unchecked and 43 seconds to load with it checked. There could be significant time savings with a large database.
Projects window, Setting tab, Summarized Data
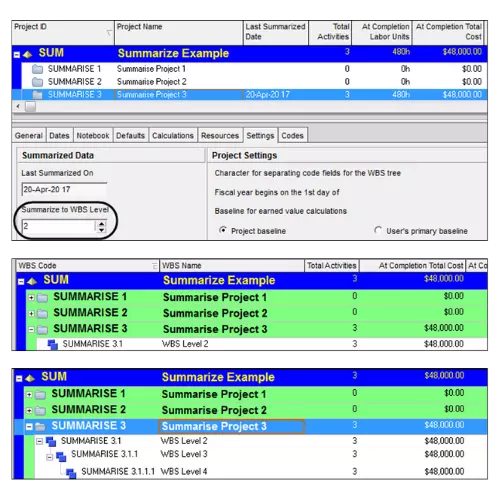
The Projects window, Setting tab, Summarized Data determines how many levels of the WBS is saved in the Summary table and available in the Tracking window. If Summarize to WBS Level 2 is selected then only the Project Node and the first WBS Node may be seen and the Project Node is considered by P6 as the first WSB level 1. When set to zero all levels are Summarized.
When SUMMARIZE 3 is Summarized with the setting of Summarize to WBS Level 2, as shown on the right.
Then when the project is closed you will only see WBS Level 2 in the Tracking Window. But when the project is open you will see all three levels.
Admin Preferences, Options, Specify the interval to summarize and store resource spreads
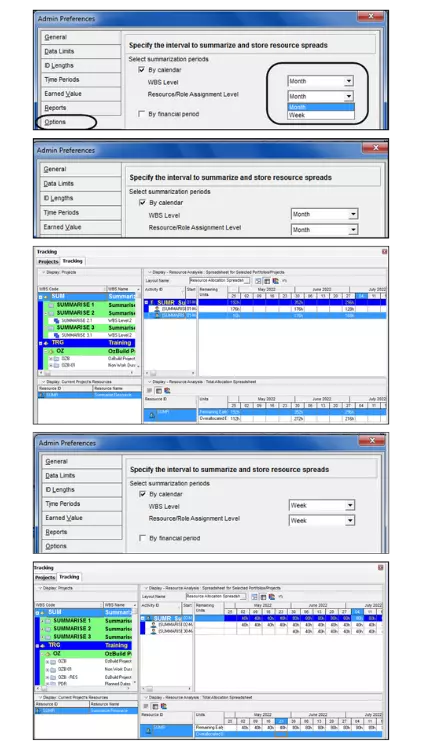
The Admin Preferences, Options, Specify the interval to summarize and store resource spreads decides at what time interval that data is save in the Summary table in weeks, months or By financial period.
The following is an example of how this works:
- When the Admin Preferences, Options, Specify the interval to summarize and store resource spreads are set to months:
- Opened the projects to be Summarized, which was Summarize1 and Summarize 2;
- Summarized the open projects;
- Closed all Projects;
- Opened Tracking window;
- Although, the timescale is set to weeks the data is displayed by months, then the monthly total is displayed in the first week because the Admin Preferences option was set to months.
- When the Admin Preferences, Options, Specify the interval to summarize and store resource spreads are set to weeks:
- Opened the projects Summarized, which was Summarize1 and Summarize 2;
- Summarized the open projects;
- Closed all Projects;
- Opened Tracking window.
- When the Admin Preferences, Options, Specify the interval to summarize and store resource spreads are set to weeks the resource spread is by weeks.
User Preferences, Resource Analysis, All Projects Options
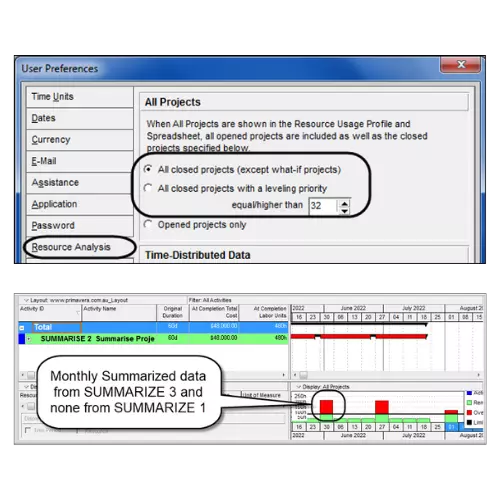
The User Preferences, Resource Analysis, All Projects options allows the reading of the Summary table resource spread data for unopened projects.
Therefore, projects must be Summarized for this to give accurate data.
- Expanding the Timescale to weeks in the Activity window will show that the Summarized data for unopened projects is by months and results in some strange histograms.
Where Summary table data is viewed - Tracking Window
When:
- NO projects are open,
- The User Preferences, Startup Filters, Resource Summary data IS NOT loaded and
Then when the Tracking window is opened:
- Then NO data is seen for projects NOT Summarised and
- The Summary Data is available at the WSB Level selected in the Projects window, Setting tab, Summarized Data
- The Resource spread Summary Data of Summarized projects IS NOT in the right-hand pane.
When:
- NO projects are open,
- The User Preferences, Startup Filters, Resource Summary data IS loaded and
Then when the Tracking window is opened:
- The Summary Data is available to the WSB Level selected in the Projects window, Setting tab, Summarized Data
- Then the Summary Data is available in the left-hand pane and
- Resources’ spreads are available in the right-hand pane to the WSB Level that is Summarised at and the Admin Preferences, Options, Specify the interval to summarize and store resource spreads
When:
- All the projects of interest are open,
- Resource Summary data IS NOT loaded
Then when the Tracking window is opened,
- All levels of the WBS are available and
- Resource spreads are available down to the lowest level of the WBS in time increments less than a week.
Where Summary table data is viewed - Activities Window
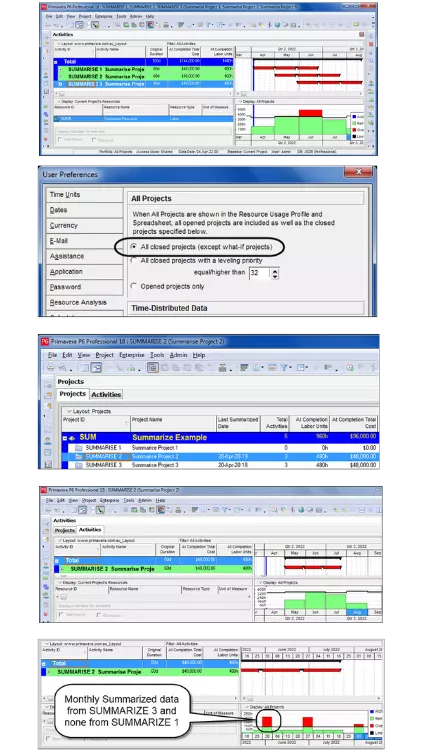
When all Projects are opened the histogram displays an overload as there are three activities at the same time and the resource has an availability of 2 (16 hours per day).
When:
- The All closed projects (except the what-if projects) is selected in the User Preferences, Resources Analysis form;
- When there is a project that has resources that need to be included in the analysis and has not been Summarised, which is SUMMARIZE 1, then it is not included in the Resource histogram;
- You will see on the right that only the resources from SUMMARIZE 2 and SUMMARIZE 3 are displayed in the histogram because SUMMARISE 1 is not Summarised;
- Expanding the Timescale to weeks in the Activity window will show that the Summarized data for unopened projects is by months and results in some strange histograms.
Recommendations
When a User is:
- Reading unopened project resource data in the Project windows, or
- Using the Tracking window with unopened project, or
- Analysing resource spread data from multiple projects in the Activities window
The following recommendations are made:
- Projects should be Summarised nightly using Job Services to ensure data in the Projects window is the latest.
- It is better to open all the projects when you wish to analyse resources from multiple projects as all WBS levels are visible and the resource spread may be read down to days and users are not constrained by database setting that users may not have control of.
- When all projects are not opened then:
- Summary resource spread data will only be available to the users when the User Preferences, Startup Filters, Resource Summary Data option is checked.
- The Projects window, Setting tab, Summarized Data determines how many levels of the WBS is Summarized, this should be reviewed and set as required.
- The Admin Preferences, Options, Specify the interval to summarize and store resource spreads decides at what time interval that Summarized data is saved, this should be reviewed and set as required.
- Summarize any project that have been changed since they were last Summarized.
If you want to learn more about Planning and Control with Microsoft Project, please check out my online course here.


Leave your thoughts here...
All Comments
Reply