How to Become a Data Analyst: A Practical Guide

So, you want to become a data analyst? It's a fantastic goal, and the path to get there is more straightforward than you might think. Forget what you've heard about needing a computer science degree. This journey is built on three core pillars: mastering the right skills, building a portfolio that shows what you can do, and then confidently tackling the job market.
Jump To Section

Earn As You Learn
Earn 25% commission when your network purchase Uplyrn courses or subscribe to our annual membership. It’s the best thing ever. Next to learning,
of course.
Your Realistic Path to a Data Analyst Career
Let’s bust a big myth right now: you don't need to learn every single complex tool before you can get started. The road to becoming a data analyst is a methodical one, perfect for anyone making a career change. We’ve seen people from all sorts of backgrounds—marketing coordinators, retail managers, you name it—successfully pivot by focusing on practical, hands-on application instead of getting lost in theory.
This roadmap is designed to cut through the noise and give you a clear plan. We'll start with the key stages, a realistic timeline, and the absolute must-have skills you'll need.
And the timing couldn't be better. The demand for data skills is exploding. The U.S. Bureau of Labor Statistics (BLS) projects that jobs for data analysts and similar roles will grow by a massive 23% between 2023 and 2033. That's way faster than the average for all other jobs. It's a global trend, too—India is expected to have 11 million job openings for data analysts by 2026. The opportunity is huge.
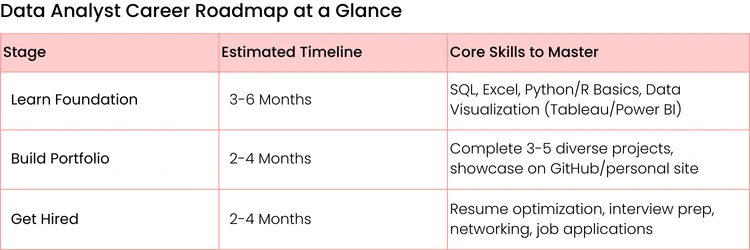
The Three Core Stages of Your Journey
Breaking into data analysis really boils down to a three-stage process. First, you learn the essential skills. Then, you build a compelling portfolio. Finally, you launch your job search.
This visual gives you a great high-level look at how it all fits together.
Each of these phases builds directly on the one before it, making sure you develop a practical skillset that hiring managers are actually looking for.

Setting a Realistic Timeline
The big question everyone asks is, "How long will this take?" While it definitely varies depending on your starting point and how much time you can commit, a structured plan can get you job-ready faster than you might expect.
Here’s a rough idea of what to expect:
- 3-6 Months: This is a solid timeframe for motivated learners who can dedicate about 10-15 hours a week. In this period, you can realistically master the fundamentals (like SQL, Excel, and a data visualization tool) and build 2-3 strong portfolio projects.
- 6-12 Months: If you're juggling a full-time job or other big commitments, a more relaxed pace allows for deeper learning and a more impressive portfolio. This timeline is perfect for making sure you not only learn the skills but can also apply them with genuine confidence.
Actionable Insight: The real key isn't speed—it's consistency. Sticking to a structured learning plan is far more effective than trying to cram everything in during intense, sporadic study sessions. Try this: Block out non-negotiable "study time" in your calendar—even if it's just three 30-minute sessions a week. This consistency is great practice for the detail-oriented work you'll be doing as a data analyst.
To help you visualize this, here's a quick summary of the journey ahead. This table maps out the essential phases, from mastering the tools to landing your first role. It’s your high-level guide to turning your ambition into a reality.
Mastering Your Core Technical Toolkit
Building your data analyst toolkit is a lot like stocking a workshop. You don't just grab every shiny tool you see; you start with the essentials—the hammer, the screwdriver, the measuring tape. It’s not about memorizing every single function, but about knowing which tool to grab to solve a specific business problem. This is where your journey truly gets hands-on.
The core skills for data analysis have become pretty clear over the years. Industry data tells a consistent story: SQL is non-negotiable, Python is a massive leg up, and knowing your way around a visualization tool is crucial for getting your point across.
In fact, a staggering 80% of data analyst job postings list SQL as a must-have. Around 70% are looking for Python, and more than 60% want to see that you can build compelling stories with tools like Tableau or Power BI. It's clear what employers are looking for.
Start with SQL: The Language of Data
Think of SQL (Structured Query Language) as your universal key to every data kingdom. It’s how you talk to databases to ask for the information you need. Before you can work your analytical magic, you have to get the data, and SQL is how you do it.
Don't just run generic practice queries. Tie your learning to a real-world business question.
Actionable Example: A Sales Query
Imagine your manager walks over and asks, "What were our top 10 best-selling products last quarter, and how much money did each one bring in?"
You wouldn't just pull a random list. You'd write a SQL query to:
- JOIN the sales table with the products table to connect sales data with product names.
- FILTER the results to only include sales from Q3 using a WHERE clause.
- GROUP BY the product name to lump all sales for each item together.
- CALCULATE the total revenue for each product using SUM(price * quantity).
- ORDER BY that total revenue from highest to lowest and use LIMIT 10 to grab just the top performers.
That single query answers a vital business question and shows you can think like an analyst.
Choose Your Programming Weapon: Python or R
Once you’ve pulled the data with SQL, you need to roll up your sleeves and get it ready for analysis. This is where a programming language like Python or R comes into play. While both are fantastic, most beginners find Python's clean syntax and versatility a bit easier to pick up.
Instead of getting overwhelmed, focus on the libraries that do the real heavy lifting:
- Pandas: This will be your absolute best friend for data manipulation. Use it to load messy datasets, fill in missing values, and wrestle data into a clean, structured format.
- Practical Example: You could use Pandas to take a raw CSV of customer feedback, instantly drop duplicate entries with .drop_duplicates(), and standardize all the date formats with to_datetime() in just a few lines of code.
- NumPy: This is the engine for all things numerical in Python. It’s incredibly fast and efficient for performing complex math on huge arrays of data.
- Matplotlib & Seaborn: Your go-to libraries for creating initial charts and graphs. Use them to get a quick visual sense of your data—spotting trends and outliers before you dive deeper or move to a more powerful tool.
Actionable Insight: Don't try to learn everything at once. Get really, really good at Pandas first. The ability to efficiently clean and structure data is where analysts spend most of their time, and it's a skill that will set you apart. Try this: Download a messy dataset from Kaggle and challenge yourself to clean it using only Pandas. Document every cleaning step you take.
Don't Underestimate Mighty Excel
Sure, it might not have the same "wow" factor as a Python script, but Microsoft Excel is an absolute workhorse in the business world. Why? Because everyone uses it. Your stakeholders in marketing, sales, and finance live and breathe in spreadsheets.
Excel is perfect for quick, ad-hoc analyses and creating simple, clean charts that anyone can understand. Knowing how to analyze data in Excel is a practical skill you'll use constantly.
Practical Use Case:
Your marketing manager drops a spreadsheet on you with the latest campaign results. They need a quick summary for their weekly meeting... which is in an hour. Instead of spinning up a whole new project, you can use Excel to:
- Instantly create Pivot Tables to summarize performance by marketing channel.
- Use VLOOKUP or XLOOKUP to pull in cost data from another sheet.
- Build a simple bar chart showing click-through rates for different ad creatives.
This speed and accessibility make Excel a crucial tool for delivering fast answers and communicating clearly.
Tell Stories with Data Visualization Tools
At the end of the day, your insights are only as good as your ability to communicate them. This is where data visualization tools like Tableau or Power BI come in. These platforms let you build interactive dashboards that tell a compelling story with data.
Your goal isn't just to make pretty charts. It's to guide your audience toward an "aha!" moment.
Real-World Scenario: Visualizing Customer Churn
Let's say you've analyzed customer data and figured out why people are canceling their subscriptions. Instead of showing a boring table of numbers in a meeting, you build a Tableau dashboard.
This dashboard could feature:
- A map highlighting churn rates by state or country.
- A bar chart that breaks down churn by subscription plan type.
- A timeline that shows churn is highest in the first 30 days of a customer’s journey.
By presenting the data this way, you make the insight impossible to ignore. Stakeholders can immediately see that, for example, most churn is happening with new customers on the basic plan in the Midwest. That's not just data; it's an actionable insight that can drive real business strategy.
Building a Portfolio That Gets You Hired
Your portfolio is your single most powerful tool for proving you can do the job, especially if you’re breaking into the field without years of formal experience. It’s what turns abstract skills on a resume into tangible, undeniable proof of your abilities. This is where you don't just tell a hiring manager what you know—you show them how you think.
The secret is to build projects that feel like real-world business challenges, not just another class assignment. Put yourself in the shoes of a junior analyst who’s just been handed their first real task. Your goal is to showcase your entire problem-solving process, from start to finish.
From Classroom Theory to Business Reality
Let’s be honest, recruiters have seen the Titanic dataset analyzed a thousand times. If you want to stand out, you have to frame your projects around concrete business goals. Don’t just explore a dataset; use it to solve a problem.
So, instead of a generic title like "Customer Data Analysis", try reframing it as a business task. Something like, "Identifying Key Drivers of Customer Churn for a SaaS Company". This immediately tells a hiring manager that you get it—you understand that data analysis exists to drive business decisions.
Actionable Insight: Your portfolio should tell a story. Each project needs a clear beginning (the business problem), a middle (your analysis), and an end (your actionable insight). It’s not about building the most complex model; it’s about showing a clear, logical thought process that leads to a recommendation.
This approach proves you can take a vague request and turn it into a structured analytical project, which is a core skill every single data analyst needs.
Curating a Diverse Set of Projects
You don't need dozens of projects. Aim for three to five solid, well-documented projects that showcase a range of skills and business scenarios. Think of it as demonstrating your versatility. Each project should flex a different analytical muscle.
Here are a few practical ideas that look like something you’d actually do on the job:
- SaaS Customer Churn Analysis: Imagine you're an analyst at a software company. Grab a dataset from a platform like Kaggle and figure out the top reasons customers are canceling their subscriptions. Your objective? Give the product team insights to help reduce churn by 5%.
- Marketing Campaign ROI Analysis: Put on your marketing analyst hat for a retail brand. Analyze social media engagement and sales data to measure the return on investment (ROI) of a recent campaign. Your final report should advise the marketing director on where to put their budget next quarter.
- E-commerce Inventory Optimization: Step into the role of an operations analyst for an online store. Use historical sales data to forecast demand and recommend ideal inventory levels for the top 50 products, with the goal of cutting overstock costs.
These projects are compelling because they have a clear business context and a measurable outcome. They feel real.
Documenting Your Process on GitHub
A finished dashboard is nice, but recruiters and hiring managers want to see the "how". How did you get there? This is where GitHub becomes your best friend. It’s the perfect place to host your code and, more importantly, to document your entire analytical process.
For every project, your GitHub repository should be a complete, easy-to-follow walkthrough of your work.
What to Include in Each Project README
- The Business Problem: Kick things off with a clear, concise statement of the problem you're trying to solve. Why does this analysis even matter? (e.g., "The business needs to understand why Q3 sales dropped.")
- The Dataset: Briefly describe where your data came from, what it contains, and any limitations you noticed.
- Your Process: Detail your steps. Talk about your data cleaning, exploratory data analysis (EDA), and the specific techniques you used. This is your chance to explain why you made certain choices.
- Key Findings & Visualizations: This is the highlight reel. Showcase your most important charts and summarize the main insights you uncovered.
- Actionable Recommendations: End with clear, data-driven recommendations for the business. This is the most critical part—it proves you can turn raw data into a real strategy.
Documenting your work this way shows you're not just a "code monkey"; you're a strategic thinker. A huge part of the job is presenting your findings effectively, and understanding the principles behind data storytelling as a risk analyst can give you a massive advantage. Your portfolio is your first and best chance to tell a compelling story about your own analytical talent.

Crafting Your Resume and Nailing the Interview
You’ve put in the work and built a solid foundation of technical skills and portfolio projects. Fantastic. Now, the real trick is connecting all that effort to what hiring managers actually care about. This part of the journey is all about translating your hard work into a story that gets you in the door and helps you shine once you're there.
Rewrite Your Resume for Impact
The single biggest mistake we see from aspiring data analysts is a resume filled with tasks instead of results. A hiring manager doesn't just want to know you can "analyze data with Python". They want to know why it mattered. What happened because of your work?
Ditch the passive descriptions and reframe your experience with a simple but powerful formula: Action Verb + Skill/Tool + Measurable Result.
Let’s see it in action:
- Before: "Analyzed customer feedback data using Python." (Okay, but so what?)
- After: "Used Python and Pandas to analyze 5,000+ customer feedback entries, identifying a recurring login issue that led to a 10% reduction in support tickets after a fix was implemented."
See the difference? The "after" version is a home run. It shows your technical chops, quantifies the scope of your work, and links your analysis directly to a positive business outcome. When you're putting together your resume for a data analyst role, understanding the specifics of writing a technical resume is what gets you past the initial screening.
Actionable Insight: Your resume isn't just a list of what you've done; it's a collection of evidence proving you can create value. Every bullet point should answer the silent question from the recruiter: "So what?" Review each line of your resume and if it doesn't demonstrate impact, rewrite it using the formula above.
For a deeper dive, check out this guide on how to write a resume that will actually get a recruiter's attention.
Demystifying the Interview Gauntlet
Data analyst interviews are usually a multi-stage marathon, not a sprint. Each stage is designed to test a different part of your skillset, so knowing what's coming gives you a massive edge.
The Technical Screening
This is often the first hurdle, a quick gut-check to see if you have the foundational skills. Expect a timed online quiz or a live coding session that is almost always focused on SQL.
- What to expect: You’ll likely face problems requiring JOINs, GROUP BY clauses, and window functions like ROW_NUMBER(). They want to see if you can handle complexity.
Actionable Insight: Don't just practice simple queries. Get comfortable joining three or more tables and running calculations within the query itself. Try this: Find sample SQL interview questions online that require you to identify "the second-highest" or "top N per category" to practice using window functions.
The Take-Home Case Study
Next up, you'll probably get a dataset and a business problem with a few days to work on it. This is your chance to show them how you think. They care less about the "right" answer and more about seeing a logical, structured approach.
Practical Example: Imagine you’re given sales data for an e-commerce company and asked to find ways to boost revenue. A strong response would be a well-structured report or a short presentation that covers:
- Data Cleaning: Briefly explain the steps you took to handle missing values or messy data. Show your work.
- Exploratory Analysis: Include a few key charts showing trends, like sales over time or top-performing product categories. Make it visual.
Actionable Insights: This is the most important part. Conclude with 2-3 clear recommendations backed by your data. For instance, "Promote Product X to customers who bought Product Y, as our analysis shows a high purchase correlation."
The Behavioral and Portfolio Interview
If you make it to the final stage, it’s all about communication and collaboration. You'll walk through a portfolio project and answer those classic behavioral questions. The STAR method (Situation, Task, Action, Result) is your best friend here.
Frame your project stories using this structure. It works every time.
- Situation: "My project was focused on understanding customer churn for a subscription box service."
- Task: "The goal was to figure out the key factors that predicted whether a customer would cancel."
- Action: "I used Python to clean the data, ran a logistic regression to find the most predictive variables, and then built a simple Tableau dashboard to visualize the findings."
- Result: "The analysis showed that customers who didn't use the mobile app in their first week were 3x more likely to churn. Based on that, I recommended a new onboarding campaign to drive early app engagement."
Telling your story this way makes your experience clear, concise, and incredibly compelling. It proves you’re not just a technician—you’re a problem solver.

Choosing Your Best Learning Path
Deciding how you're going to learn data analysis is your first big strategic move. There's no single "right" answer here—the best path is the one that actually fits your life, your budget, and how you learn best. Are you a recent grad? A career-changer looking for a fast track? A disciplined self-starter? Your answer will point you in the right direction.
Let's be honest, making a smart choice now lays the groundwork for everything that comes next.
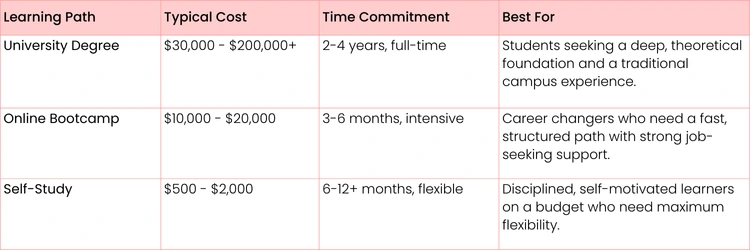
University Degrees: The Deep Dive
A traditional university degree in a field like statistics, computer science, or business analytics gives you a deep, theoretical foundation. It's the long game. This route is fantastic for building a solid network and often includes structured internships, which can be a huge leg up.
The catch? It’s a major commitment of both time and money.
- Practical Example: A high school grad wanting the full campus experience might go for a Bachelor of Science in Data Analytics. They'll spend four years learning not just SQL and Python but also calculus, linear algebra, and even business ethics. It’s an incredibly well-rounded—but slow—path to the job market.
Online Bootcamps: The Fast Track
If you're changing careers and need to get job-ready now, a data analytics bootcamp is probably on your radar. These are intense, focused programs designed to teach you the most in-demand skills in a compressed timeframe, usually 3-6 months. The entire curriculum is built around practical application and getting a portfolio built, fast.
The trade-off is a high-pressure environment and a significant upfront cost (though still less than a four-year degree). A huge plus is that many bootcamps offer robust career services, like resume help and interview coaching, which is invaluable when you’re trying to break into a new field.
Actionable Insight: Choosing a learning path is less about which one is "best" and more about which one best aligns with your life. A working parent might find a self-paced online course ideal, while a recent grad might benefit more from the structure of a bootcamp. Be honest about your resources, discipline, and goals.
The Self-Study Route: All About Discipline
The self-study path, pieced together with resources from platforms like Uplyrn offers total flexibility and is by far the most affordable option. This route is perfect for highly disciplined, self-motivated people who want to customize their curriculum around their specific career goals.
Actionable Insight: If you go this route, structure is your best friend. Seriously. Create a non-negotiable weekly schedule. For example: Monday and Wednesday nights are for SQL practice, Tuesdays and Thursdays are for your Python course, and Saturdays are for chipping away at a portfolio project. Without that self-imposed structure, it’s just too easy to lose momentum.
There are a ton of great online courses for career growth that can add some much-needed structure to your self-study plan.
Where Do Certifications Fit In?
Certifications can be a fantastic way to validate your skills, especially if you don't have a formal degree in the field. But you have to be strategic about them.
- Foundational Certifications: Something like the Google Data Analytics Professional Certificate is perfect for beginners. It offers a structured curriculum and gives you a recognized credential that tells employers you’ve covered the core concepts.
- Tool-Specific Certifications: Credentials for a specific tool like a Tableau Desktop Specialist or a Microsoft Power BI certification are usually best pursued once you have some experience. They show you have specialized expertise and can be a great bargaining chip for a promotion or a more advanced role.
At the end of the day, the "best" learning path is simply the one you can stick with. Take a hard look at your personal situation, weigh the pros and cons of each option, and then commit.
Comparison of Data Analyst Learning Paths
To make the decision a bit clearer, let's lay out the key differences between these paths. Evaluating them side-by-side can help you pinpoint which one truly matches your personal and professional goals.
Ultimately, no table can make the decision for you, but seeing the numbers in black and white can definitely help you weigh the trade-offs.
Common Questions About Starting a Data Analyst Career
Jumping into a new career path always stirs up a few questions. As you start mapping out your journey to becoming a data analyst, you’re bound to hit some uncertainties. Let’s clear the air and tackle the most common questions we hear from aspiring analysts.
Do I Really Need a Math or Computer Science Degree?
This is probably the biggest myth holding people back, so let's bust it right now. While a degree in a quantitative field can be helpful, it is absolutely not a requirement.
These days, hiring managers are far more interested in your demonstrable skills and a solid portfolio than the specific major printed on your diploma. In fact, your unique background can be a massive advantage.
- Practical Example (Marketing): You already get customer behavior and campaign metrics. Build a portfolio project analyzing marketing ROI or customer segmentation. That's a skill companies will immediately recognize and value.
- Practical Example (Healthcare): You have domain knowledge about patient data, clinical trials, or hospital operations. A project analyzing patient readmission rates will be way more impressive to a healthcare company than a generic analysis anyone could do.
At the end of the day, employers want to know if you can solve their problems. A well-executed project that shows how you could save a hypothetical company money is way more powerful than a piece of paper.
How Can I Get Experience When I Don’t Have a Job?
The classic chicken-and-egg problem. You need experience for a job, but you need a job for experience. The trick is to stop waiting for permission and start creating your own experience. Personal projects are a great starting point, but you can take it a step further to really stand out.
Don't just work in a bubble—get involved with the data community.
- Actionable Insight (Competitions): Jump into a beginner-friendly competition on a platform like Kaggle. You don’t even have to win. Just participating and documenting your entire process on GitHub shows incredible initiative.
- Actionable Insight (Freelancing): Check out platforms like Upwork or Fiverr for small, one-off tasks. A simple gig like "clean my 500-row Excel sheet" or "create a sales dashboard in Google Sheets" is a perfect way to start. You get paid, you get a real client testimonial, and you get a legitimate work item for your resume.
Your goal isn't just to practice your skills; it's to generate proof that you can do the work. Contributing to an open-source project or finishing a small freelance job shows you can collaborate and hit a deadline—two things every single employer is looking for.
What’s the Real Difference Between a Data Analyst and a Data Scientist?
The titles get thrown around and sometimes used interchangeably, but the day-to-day focus is actually quite different. The easiest way to remember the distinction is by thinking about the core question each role tries to answer.
A data analyst spends most of their time looking at past and present data to answer, "What happened and why?" They're focused on descriptive and diagnostic analytics—making sense of what's already occurred.
- Real-World Example: An analyst at an e-commerce company might build a Tableau dashboard showing that sales in the Northeast dropped by 15% last quarter. Their next step would be digging into the data to figure out why—maybe discovering it coincided with a competitor's big marketing push in that region.
A data scientist, on the other hand, uses past data to answer, "What is likely to happen next, and how can we influence it?" Their work is all about predictive and prescriptive analytics, which often involves building machine learning models.
- Real-World Example: A data scientist at that same company would use historical sales data to build a model that predicts which customers are most likely to churn in the next 90 days. The business could then use that list to proactively offer those specific customers a discount to keep them around.
Is AI Going to Take My Job as a Data Analyst?
Nope. AI isn't replacing data analysts—it's giving them superpowers. Think of artificial intelligence and automation as powerful assistants that handle the most tedious, repetitive parts of the job.
This frees you up to focus on what humans do best: strategic thinking, applying business context, and asking the right questions.
Instead of spending 80% of your time cleaning messy data, an AI tool might slash that down to a fraction of the time. This means you have more brainpower left for the high-value tasks.
- Practical Example: You could use an AI tool to automatically generate the initial Python code for cleaning a dataset. Your job then shifts to verifying that code, interpreting the results, and deciding on the next strategic step for the analysis. You're the pilot, not the engine.
The role is evolving from data technician to data strategist. Learning how to effectively use AI tools will make you far more valuable, not obsolete.
Ready to build the skills that will land you a job in data analytics? At Uplyrn, we provide the hands-on courses and expert mentorship you need to succeed. Start your learning journey today and join tens of thousands of students who are taking control of their careers.


Leave your thoughts here...
All Comments
Reply