What Is Data Science and Analytics Explained for You

Here’s the simple truth: data analytics is all about understanding the past, asking the question, “what happened?”. Data science, on the other hand, is about predicting the future by asking, “what might happen next?”.
Think of a data analyst as a sharp detective, meticulously piecing together existing clues to solve a case. A data scientist is more like a criminal profiler, using all that information to forecast the culprit's next move.
Jump To Section

Earn As You Learn
Earn 25% commission when your network purchase Uplyrn courses or subscribe to our annual membership. It’s the best thing ever. Next to learning,
of course.
Understanding Data Science and Analytics
At its core, the entire field is built on one powerful idea: using data to make smarter decisions. Both data science and data analytics aim to turn a sea of raw numbers into something truly useful, but they get there from different directions and with different toolkits. Getting this distinction right is key for anyone looking to break into the field or just use these skills to make a bigger impact at work.
And the demand for these skills is absolutely exploding. The data analytics market is expected to rocket from USD 82.33 billion in 2025 to a massive USD 302.01 billion by 2030. That's not just a statistic; it’s a clear signal of just how critical this field has become, driven by companies desperate to create personalized experiences and stay ahead of the competition.
The Role of Data Analytics
Data analytics is primarily focused on sifting through large datasets to spot trends, answer specific questions, and figure out what’s already happened. It’s all about providing hindsight by cleaning, transforming, and modeling data to pull out the nuggets of information that can guide better business decisions right now.
- Practical Example: A data analyst at a retail company might dive into last quarter's sales figures to pinpoint the best-selling products by region. They would create a report showing that winter coats sold exceptionally well in the Northeast but poorly in the Southwest.
- Actionable Insight: A good analyst doesn't just stop at reporting "Coats sold well in the Northeast." They dig deeper to understand the why. Was it a specific marketing campaign? A colder-than-average winter? This insight allows the marketing team to replicate successful ad campaigns in other cold regions and helps the inventory team adjust stock levels for the next season, preventing overstock in warmer climates.
The whole process is about painting a crystal-clear picture of the past to inform your actions in the present. If you want to dive deeper into these foundational skills, check out this course on data analysis.
The Role of Data Science
Data science takes everything a step further. It's a much broader field that pulls from scientific methods, complex algorithms, and advanced systems to wring knowledge out of all kinds of data—both the neat, structured kind and the messy, unstructured stuff.
While analytics is busy explaining the past, data science uses that information as a launchpad to predict the future.
- Practical Example: A data scientist at that same retail company would take that historical sales data and combine it with other variables—like website traffic, social media sentiment, and long-range weather forecasts—to build a predictive model using machine learning.
- Actionable Insight: This model doesn't just look backward; it forecasts future demand for specific products, down to the SKU level for each store. This is a game-changer. It allows the company to automatically adjust its supply chain, optimize pricing for maximum profit, and launch targeted marketing campaigns before a trend even hits its peak, preventing costly stockouts or overstock situations.
To make these differences even clearer, let's break it down side-by-side.
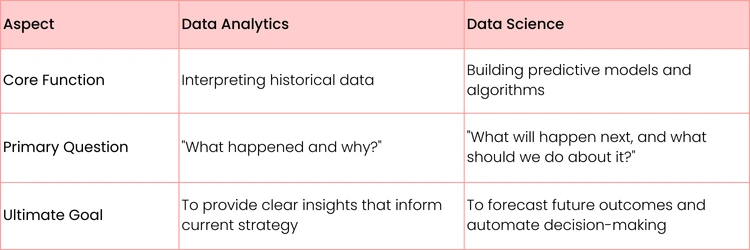
Data Science vs Data Analytics at a Glance
This table boils down the key distinctions between the two disciplines, from the questions they ask to the goals they ultimately aim to achieve.
As you can see, while they often work with the same raw materials (data), their focus and their final deliverables are fundamentally different. One looks in the rearview mirror to navigate the road ahead, while the other builds a GPS to map out the future.
The Journey From Raw Data to Actionable Insights
Think of raw data as a giant, messy pile of puzzle pieces. On its own, it’s just chaos. The real magic happens when data professionals start sorting through that mess, turning it into a clear picture that can guide a business. It’s a methodical journey that starts with a simple question and ends with a specific, valuable answer.
Let’s follow this process with a classic, high-stakes problem for an online retailer: customer churn. The business question is straightforward but urgent: "Why are our customers leaving, and what can we do about it?" This single question kicks off a workflow where both data analytics and data science have crucial, interconnected parts to play.
Stage 1: The Foundation of Data Preparation
You can’t build a house on shaky ground, and you can’t get reliable insights from messy data. This first stage is all about creating a solid foundation.
- Data Collection: First, you have to gather the pieces. This means pulling information from all over the place—customer purchase histories from the sales database, browsing logs from the web server, support tickets from Zendesk, and even demographic data from a third-party provider.
- Data Cleaning: This is the unglamorous but absolutely essential part. It’s about fixing typos in state names, deleting duplicate orders, and deciding how to handle missing phone numbers. Clean data is the bedrock of trustworthy analysis.
- Exploratory Data Analysis (EDA): With the data finally clean, the initial investigation can begin. Analysts use basic visualizations to find patterns. A simple histogram might quickly reveal that customers who haven't made a purchase in 90 days are far more likely to churn, giving the team a concrete metric to focus on.
For this process to work smoothly, information needs to flow seamlessly. That's where well-structured Data Pipelines come in, automating how data moves from its source to the tools where it can be analyzed.
Stage 2: Where Analytics and Science Diverge
Once the data is prepped and ready, the paths of the data analyst and the data scientist start to fork, even though they’re both tackling the same churn problem. This is where you can really see the core difference in their approaches.
Key Takeaway: Data analytics looks backward to explain what happened and what’s happening now. It’s all about creating a clear view of the past. Data science uses that same historical data to look forward, building models that predict what’s likely to happen next.
Stage 3: Delivering Actionable Insights
In the final stage, both roles deliver their findings, but their outputs are tailored to their specific goals. Each provides a unique and vital piece of the puzzle to solve customer churn.
The Data Analyst's Contribution: The analyst creates an interactive dashboard. This tool might show churn rates broken down by city, product category, or how the customer was acquired. A marketing manager could click on "Social Media Ads" and immediately see that these customers churn at twice the rate of others. Just like that, they have a clear problem to investigate and can decide to re-evaluate their ad spend on that channel. The analyst reveals what happened.
Effectively communicating these findings is a skill in itself. To learn more about turning data into a compelling argument, check out this guide on data storytelling as a risk analyst.
The Data Scientist's Contribution: Using the exact same clean data, the data scientist builds a predictive machine learning model. This model goes beyond just reporting on past churn; it assigns a "churn risk score" from 1-100 to every single active customer. It flags the specific individuals who are at high risk of leaving in the next 30 days.
This allows the company to get ahead of the problem. They can automatically send a targeted 15% discount to customers with a risk score over 80, or have a support agent personally call those with a score over 95, preventing churn before it even happens. The scientist predicts what will happen.
The infographic below helps visualize how these two paths take the same raw material and shape it into completely different kinds of business value. As you can see, analytics is about finding existing patterns with charts and reports. Data science is about using that information to forecast the future.
Your Essential Data Professional Toolkit
Jumping into data science or analytics is a lot like learning a craft—you need the right set of tools. This isn't just about a list of software to download. It's about building a versatile toolkit that lets you query, clean, model, and ultimately, bring data to life.
Knowing how these tools fit together is what separates a novice from an expert, allowing you to tackle complex business problems from start to finish. A professional's daily toolkit often shifts based on their specific role or project, but a few core categories are the bedrock of nearly every data-driven task.
Programming Languages: The Workhorses of Data
Programming languages are the powerful engines driving both data science and analytics. They give you the raw power to manipulate data, automate tasks, and build custom solutions in ways that off-the-shelf software just can't touch.
Python is, without a doubt, the king of the hill. Its straightforward syntax, combined with an enormous ecosystem of libraries, makes it a true powerhouse for almost any data task imaginable.
- Practical Example: An e-commerce analyst can use Python's Pandas library to pull in messy sales data from a spreadsheet, instantly fix inconsistent date formats, remove rows with missing prices, and calculate month-over-month growth—all in just a few lines of code.
- Actionable Insight: This automates a process that would be painfully slow and error-prone in Excel. You can build a script once to clean a monthly report and then run it every single month with a single click, saving countless hours and ensuring your results are always consistent and trustworthy.
If you're ready to build this foundational skill, this guide to the complete Python bootcamp is a fantastic place to start.
While Python is the all-rounder, R is another major player. It's especially beloved in academic circles and specialized statistical research for its incredibly robust packages for data visualization and complex modeling.
Databases and SQL: The Language of Data Retrieval
Data rarely sits in a single, perfectly organized file. It's usually stored in massive databases, and knowing how to speak their language is a non-negotiable skill. That's where SQL (Structured Query Language) comes in.
SQL is the universal standard for talking to relational databases. It empowers you to ask very specific questions and pull the exact slice of data you need, no matter how large the dataset.
- Practical Example: Imagine a data analyst at a streaming service. They might write a SQL query to join the users table with the viewing_history table, filtering for users who watched more than 10 hours last week but whose subscription is up for renewal next week.
- Actionable Insight: Mastering SQL means you're no longer waiting on someone else to give you data. With that query, you've just created a perfect target list for a re-engagement marketing campaign. The marketing team can now send a "Don't miss out!" email to this specific, highly engaged group, significantly increasing the chances they'll renew.
Visualization Tools: Telling Stories with Data
Let's face it: raw numbers and spreadsheets are boring and hard to interpret. This is where data visualization tools like Tableau and Microsoft Power BI shine. They transform dense, complex datasets into beautiful charts, graphs, and interactive dashboards that anyone can understand.
These tools are absolutely critical for communicating your findings to managers, clients, or anyone who doesn't have a technical background.
- Practical Example: A marketing manager can use a Power BI dashboard to get a live pulse on campaign performance. With a few clicks, they can filter by "Instagram Ads", see a map highlighting which cities have the highest click-through rates, and drill down into a bar chart showing the age demographics of who is responding.
- Actionable Insight: This allows for real-time campaign adjustments. Seeing that 18-24 year olds in Chicago are responding well, the manager can immediately shift more of the ad budget to target that specific group, optimizing spend and improving ROI on the fly without waiting for a weekly report.
The demand for these platforms is exploding. The entire data science platform market, which includes these technologies, was valued at USD 194.09 billion in 2025 and is projected to hit an incredible USD 897.77 billion by 2033. This growth shows just how essential these integrated tools have become for turning data into clear, actionable insights. You can learn more about the growth of the data science platform market and its impact across industries.
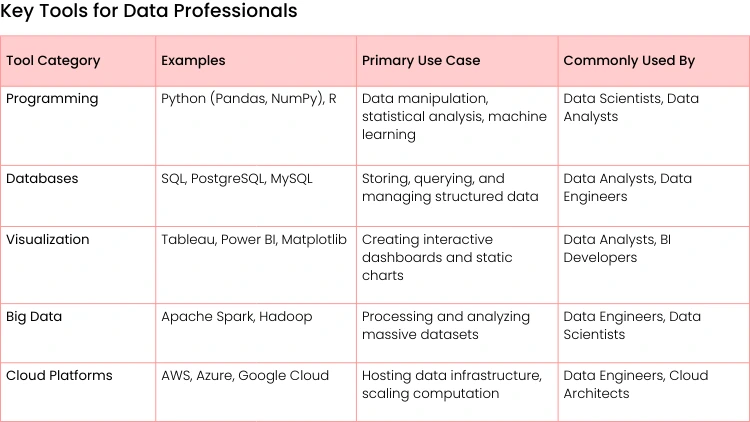
A Quick Look at the Toolbox
To tie it all together, here’s a breakdown of the essential tools and where they fit into the data landscape. Think of this as your starter kit for building a career in data.
Each category serves a unique purpose, but the real magic happens when you know how to combine them to solve a problem from beginning to end.
How Data Drives Real-World Innovation
Alright, we’ve covered the "what" and "how" of data science and analytics. Now for the exciting part—seeing these fields in the wild, where theory turns into real, tangible impact. This is where data sheds its buzzword status and becomes a core asset that actually fuels strategy, efficiency, and growth.
Make no mistake, these disciplines aren't just for Silicon Valley startups. They're fundamentally changing how every major sector operates. From the way you pick a movie on a Friday night to how your bank protects your money, data is the invisible engine running in the background.
Entertainment Redefined by Personalization
Think about the last time you opened a streaming service. That perfectly curated list of "Top Picks for You"? That's a masterpiece of data science. Netflix, for instance, has built a recommendation engine that's become the stuff of legend.
- Practical Example: Their system chews through a mountain of user data—what you watch, when you pause, what you re-watch, even the shows you search for but never click on. It then uses machine learning to get scarily good at predicting what you'll want to see next. This isn't just a cool feature; it’s a core business strategy that saves the company over $1 billion a year by keeping customers from canceling their subscriptions.
- Actionable Insight: This level of personalization is a textbook example of predictive analytics at work. It shifts the user experience from passively browsing to an active, curated journey. The actionable insight for the business is clear: investing in better recommendation algorithms directly reduces customer churn and increases viewer engagement, fattening the bottom line.
Understanding the true impact of your efforts is vital, which is why learning how to measure content marketing ROI is so critical for businesses wanting to quantify their success.
Healthcare From Reactive to Proactive
The healthcare industry is in the middle of a massive transformation, moving away from just treating sickness to proactively managing wellness—and it's all powered by data. Hospitals and clinics are now using patient data to forecast health trends and step in before small problems become big ones.
- Practical Example: One of the most powerful applications is in predicting patient readmission risks. By analyzing a patient's medical history, lab results, demographics, and even social factors, analytical models can flag individuals who are likely to end up back in the hospital soon after being discharged.
- Actionable Insight: This allows healthcare providers to get ahead of the curve. A hospital can implement an automated alert system for care coordinators. When a patient is flagged as "high-risk", the coordinator is prompted to schedule an extra follow-up call or a home health visit. This targeted intervention doesn't just improve patient outcomes; it directly reduces costly readmissions, a key performance metric for hospitals.
This data-driven approach is a perfect case study of how analytics can be used to make life-saving and cost-saving decisions.
Securing Finance with Machine Learning
The financial world operates at a dizzying speed, with thousands of transactions flying by every second. It's simply impossible for humans to manually check every single one for fraud. That’s where machine learning, a core pillar of data science, has become an absolute necessity.
- Practical Example: Financial institutions use sophisticated algorithms to analyze transaction patterns in real-time. These models learn your financial "fingerprint"—where you typically shop, your average spending habits, and the times of day you're usually active. When a transaction pops up that breaks your established pattern—say, a $500 purchase in a different country at 3 AM when you usually spend $50 near home—the algorithm immediately flags it.
- Actionable Insight: This triggers an instant, automated action. The system might automatically block the purchase and send an immediate text alert to your phone asking, "Was this you? Reply Y or N". This stops fraud in its tracks before money ever leaves the account. This proactive security is a brilliant application of data science in risk management, just as businesses can learn about data analytics for risk hedging to fortify their own financial strategies.
These stories from entertainment, healthcare, and finance all point to one clear conclusion: understanding what is data science and analytics isn't just for techies anymore. It's the key to building smarter, more efficient, and more customer-focused organizations in pretty much every industry you can think of.

Building Your Career in Data
So, you're interested in turning a passion for data into a real-deal career. Good news: it’s more doable than ever before. The trick is figuring out which role fits you best, building the right skills (both tech and human), and then proving you can solve actual problems. This isn't just about memorizing theories; it's about getting your hands dirty.
And the timing couldn’t be better. The demand for data expertise is absolutely exploding. The market for data science and predictive analytics is projected to leap from USD 25.24 billion in 2025 to a staggering USD 141.34 billion by 2035.
What's fueling this rocket ship? A huge part of it—nearly 30% of the market—is companies desperately trying to understand and predict what their customers will do next. You can get a deeper look into the future of predictive analytics and its market growth on Research Nester.
Mapping Out the Key Data Roles
The term "data professional" gets thrown around a lot, but it covers a few distinct roles. Each one has a different focus and requires a specific set of tools. Knowing the difference is your first step to finding where you belong.
- Data Analyst: Think of them as the investigator. Their job is to dig into historical data to answer specific business questions like "Which marketing channel brought us our most valuable customers last quarter?" Analysts live in SQL to pull data and use tools like Tableau to build dashboards that make trends and insights impossible to ignore.
- Data Scientist: This is the forecaster. They take the analyst's findings to the next level, using statistics and machine learning to predict what might happen in the future. They build models to answer questions like, "What is the likelihood this specific customer will cancel their subscription in the next 30 days?"
- Machine Learning Engineer: Meet the builder. This is a deeply technical role focused on taking the models data scientists create and deploying them into live, production systems. They’re the ones who make sure that customer churn model can score millions of users in real-time without crashing.
While the technical depth varies, they all share one mission: turn raw data into tangible business value.
Building a Standout Portfolio
A degree or a certificate might get your resume through the first filter, but a killer portfolio is what lands you the job. It’s the difference between saying you can do something and showing you can do it. The best way to start? Grab some public data and solve a real problem.
You don't have to look far. Websites like Kaggle, Google Datasets, and various government data portals are packed with free datasets on everything from flight delays to housing prices.
- Actionable Insight: Don't just clean the data and make a pretty chart. Frame your project around a business problem. For example, use a public dataset of Airbnb listings. Instead of just analyzing prices, build a simple model to predict listing prices based on features like location, number of bedrooms, and amenities. Then, write a summary explaining how a new host could use your findings to price their property competitively. This shows you have business sense, not just coding skills.
This approach is exactly what hiring managers are looking for. And if you want to make your visualizations truly shine, this comprehensive guide to Tableau can help you build dashboards that tell a compelling story.
The Overlooked Skills That Make You Great
Technical chops are the price of admission, but they aren't what will make you a star. The people who truly excel in data careers are more than just number-crunchers.
You have to be a great communicator and a strategic partner to the business.
- Storytelling with Data: Can you take a bunch of complex results and weave them into a clear, convincing story that a non-technical manager can understand? A brilliant model is worthless if you can’t explain why it matters.
- Business Acumen: This is all about seeing the big picture. It’s the skill of connecting your work directly to what the business actually cares about—making more money, cutting costs, or keeping customers happy.
- Curiosity: The best data pros never stop asking "why?" They have an insatiable curiosity that pushes them to look for the next question, the next layer of the onion to peel back.
Ultimately, a career in data is a marathon, not a sprint. It’s all about continuous learning and hands-on application. Focus on finding the right role, build a portfolio that shows you can solve problems, and sharpen those soft skills. Do that, and you'll be set up to not just survive, but thrive.
Common Questions About Data Careers
Stepping into the world of data careers can feel like exploring a new city—it’s exciting, but you’re bound to have a lot of questions. As you start mapping out your path, some very practical concerns always seem to pop up.
Let’s tackle some of the most common questions head-on, so you can move forward with a clear head and a solid plan.
Do I Need a PhD to Become a Data Scientist?
This is probably one of the biggest myths floating around the data world. A few years ago, seeing a PhD on a data science resume was pretty common, especially for roles heavy on pure research. But things have changed. A lot.
Today, most companies are far more interested in what you can do rather than the letters after your name. A strong portfolio of projects showing you can solve real-world business problems will almost always carry more weight than an advanced degree. Many of the best data scientists we know have Bachelor's or Master's degrees, but what really sets them apart are targeted certifications and a collection of hands-on projects. It's all about proving you can deliver value.
Now, there is an exception. If your dream is to work in a cutting-edge AI research lab or invent brand-new algorithms, a PhD is often still the ticket. But for the vast majority of data science jobs that focus on business impact, practical skills are king.
Which Is Better to Learn First: Data Science or Data Analytics?
For almost everyone just starting out, the answer is data analytics. Think of it like building a house. You wouldn't dream of putting up the walls and roof before you've poured a rock-solid foundation. Data analytics is that foundation.
You have to get the fundamentals down first, and these skills are non-negotiable:
- SQL for Data Extraction: You need to know how to pull the exact data you need from massive databases.
- Data Cleaning and Preparation: This is the unglamorous but absolutely essential work of making messy, raw data usable.
- Exploratory Analysis: Getting a feel for the data by slicing it up to spot initial trends and patterns.
- Data Visualization: Using tools like Tableau or Power BI to tell a clear, compelling story with charts and dashboards.
Once you’re fluent in this "language of data", you can start providing real value to a company right away. From there, layering on the more complex statistics, programming, and machine learning concepts of data science feels like a natural next step, not a giant leap.
- Actionable Insight: Start with SQL and a visualization tool like Tableau. Find a public dataset that interests you (like city bike-share usage) and build a simple dashboard to answer a business question, such as "Which bike stations are most popular on weekends vs. weekdays?" This not only builds your foundational skills but also gives you a tangible project to show off when you start looking for jobs.
Can AI Fully Automate Data Analytics?
AI is an incredibly powerful partner for data professionals, but it’s not a replacement. Not by a long shot. AI tools are fantastic at automating the grunt work—the repetitive, time-sucking tasks. They can clean data, generate standard reports, and spot anomalies faster than any human ever could.
This is actually great news. It frees up analysts to focus on the high-level work that machines just can’t do. The real breakthroughs, the game-changing insights, come from uniquely human abilities.
This includes things like:
- Asking the Right Questions: Understanding the core business problem you're trying to solve.
- Applying Context: Knowing the "why" behind the numbers, based on your industry knowledge.
- Communicating Findings: Weaving data points into a persuasive story that convinces people to take action.
- Strategic Recommendations: Using your analysis to suggest smart, specific business moves.
In short, AI handles the "what" so the human expert can focus on the "so what?" It makes analysts more powerful, not obsolete.
What Is the Biggest Challenge in a Data Science Project?
Talk to any seasoned data scientist, and they’ll all tell you the same thing. It’s not the fancy algorithms or the complex modeling that keeps them up at night. The hardest part of any project is everything that happens before you even get to the modeling stage.
There's a reason the "80/20 rule" of data science is so famous. The idea is that roughly 80% of a project's timeline is spent just finding, cleaning, and preparing the data. Real-world data is a mess—it’s full of errors, missing values, and all sorts of inconsistencies. Turning that raw material into something usable is a huge undertaking that demands patience and an eye for detail.
But data quality isn't the only hurdle. Another massive challenge is making sure your project is actually tied to a real business goal. You can build the most technically brilliant machine learning model in the world, but if it doesn’t solve a pressing problem or fit into how the company actually works, it’s a failure. This is why communication with stakeholders and a deep understanding of the business are just as critical as your skills in Python or SQL. The best projects are always a partnership between the tech experts and the business leaders.
Ready to build the skills that answer these questions and launch your career? At Uplyrn, we provide the practical courses and expert guidance you need to succeed in the data-driven world. Explore our programs and start your learning journey today.


Leave your thoughts here...
All Comments
Reply