Your Guide to the 1 Proportion Z Test with Examples

A 1 proportion z-test is what you reach for when you need to check if a percentage or proportion you're seeing in your data is significantly different from what you expected. It's like a reality check for claims. So when someone says, "Our new ad campaign is getting a 20% click-through rate", this test helps you find out if they're right.
Jump To Section

Earn As You Learn
Earn 25% commission when your network purchase Uplyrn courses or subscribe to our annual membership. It’s the best thing ever. Next to learning,
of course.
What is the 1 Proportion Z Test and When to Use It
Think of yourself as a data detective. You’ve got a single piece of evidence—your sample data—and a specific claim you need to prove or disprove. The 1 proportion z-test is your go-to tool for figuring out if that evidence is strong enough to make a call. It's a cornerstone of what is hypothesis testing in statistics, which is all about using data to make confident decisions.
This test is specifically for categorical data—things that fit neatly into two buckets. Think success or failure, yes or no, clicked or didn't click. It’s not for measuring continuous values like height or temperature, but for counting outcomes.
When Does This Test Come in Handy?
The power of this test is its straightforwardness. It answers a simple but vital question: "Is the proportion I found in my sample just a random fluctuation, or is it so far off from the expected value that something real is going on?"
Here are a few real-world scenarios where you'd use a 1 proportion z-test:
- Marketing Analytics: A team rolls out a new email subject line. They want to know if its click-through rate is truly better than their historical average of 18%. They can test this by sending it to a sample of 500 subscribers and analyzing the results.
- Product Management: A product manager launches a new feature, claiming it will hit a 30% adoption rate within a month. After 30 days, they can use this test on user data to see if the claim holds up.
- Quality Control: A manufacturing plant has a strict quality goal: no more than 2% of products should be defective. A quality inspector can pull a random batch and use the test to check if the defect rate is significantly higher than that 2% threshold.
Actionable Insight: Before you even collect data, clearly define the benchmark you are testing against. Is it a historical average, a competitor's claim, or an industry standard? This 'null hypothesis' proportion is the anchor for your entire analysis. Without a clear anchor, your test is meaningless.
It gives you a formal process to go from a simple observation to a conclusion backed by statistics. This is a critical skill in any data-driven field, as you'll see in this guide on what is data science and analytics. It’s how you make smart decisions, whether you're launching a product, tuning a marketing campaign, or keeping quality high.
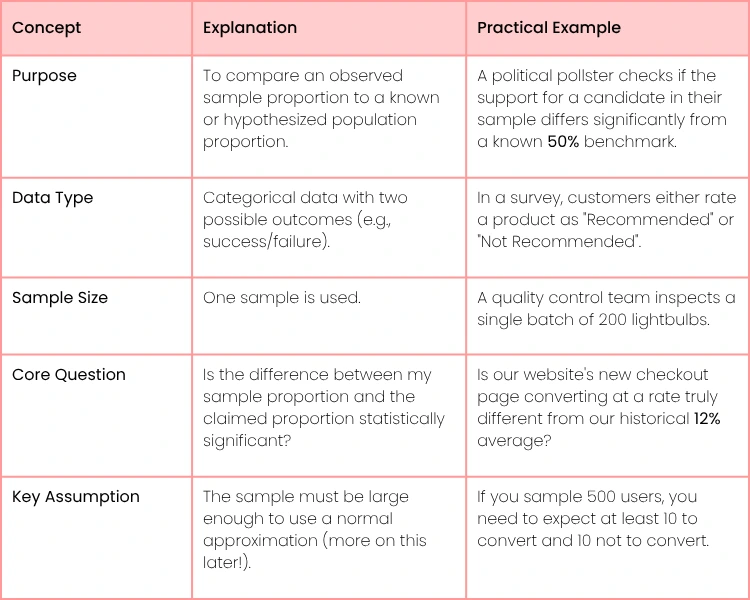
For a quick summary, here are the core components of the test.
1 Proportion Z Test at a Glance
This table gives you the essentials, but the real value comes from seeing how it works in practice.
Understanding the Assumptions of the Z-Test
Before you can confidently run a one-proportion z-test and trust its findings, you need to make sure your data plays by the rules. Think of these assumptions as a pre-flight checklist for your analysis; skipping them can send your conclusions way off course.
Getting these right ensures your results are actually valid and not just statistical noise.
First, a quick refresher on the core of any hypothesis test. You always have a null hypothesis (H₀), which is the default assumption or the status quo you're challenging. On the other side is the alternative hypothesis (H₁)—the new claim you're hoping to prove. You also set a significance level (alpha, α), usually 0.05, which acts as your decision threshold.
The Critical Conditions for a Valid Test
To run a one-proportion z-test that holds up to scrutiny, your data needs to pass three specific checks. These aren't just friendly suggestions; they're foundational to the test’s accuracy.
- Random Sample: Your data has to be collected from a random sample. This is non-negotiable. It means every single individual in your population had an equal shot at being picked, which is how you avoid bias and ensure your sample truly mirrors the larger group. A political pollster can't just call people in one neighborhood and expect the results to apply to the entire country, right? Same principle here.
- The 10% Condition: Your sample size shouldn't be more than 10% of the total population. This might seem odd, but it’s a clever way to ensure the selections are independent. If you sample too large a chunk of the population, each person you pick significantly changes the odds for the next pick, which messes with the underlying math.
- Large Counts Condition: This is the gut check for "normality". The z-test leans on the normal distribution (the bell curve) to work. To use it, you need to expect a reasonable number of "successes" and "failures". The rule of thumb is that both np₀ ≥ 10 and n(1-p₀) ≥ 10 must be true. Here, n is your sample size and p₀ is the proportion you're testing against in your null hypothesis.
Actionable Insight: What if you don't meet the Large Counts Condition? This often happens when you're studying a very rare event, like a website with a 0.1% conversion rate. Don't panic. The one-proportion z-test isn't the right tool, but you can use an exact binomial test instead. This alternative method doesn't require normal approximation and is more accurate for small counts.
Let's make this real. Imagine an online learning platform like Uplyrn, which serves over 10,000 students, wants to see if a new stats module improves course completion. The industry benchmark for completion is 60% (p₀ = 0.60).
They take a random sample of 250 students and find that 164 completed the course. Let's check the conditions. We have expected successes of np₀ = 250 * 0.60 = 150 (which is ≥ 10) and expected failures of n(1-p₀) = 250 * 0.40 = 100 (also ≥ 10). Both checks pass, so the z-test results will be trustworthy.
You can see a great walkthrough of similar problems and dive into the one-proportion z-test calculations to see it in action. Mastering these foundational checks is a huge step in any analysis.
How to Calculate the 1 Proportion Z Test Step by Step
Alright, let's get our hands dirty and walk through a 1 proportion z-test calculation. It might look intimidating at first, but it’s really just a logical, step-by-step process. Once you get the hang of it, you'll have a solid method for checking if a claim holds up to scrutiny.
The whole test boils down to one core formula. At its heart, this formula is just a way to measure the "surprise" factor: it compares what your data actually shows (your sample proportion) with what you expected to see (the hypothesized proportion). It then puts that difference into perspective based on how big your sample was.
A big z-statistic tells you the difference is significant, while a small one suggests it could just be random noise.
The Z-Statistic Formula Unpacked
The main formula that drives this test has three key ingredients. Let’s quickly break them down so you know exactly what role each one plays.
- p̂ (p-hat): This is your sample proportion. Think of it as the "success rate" you actually observed in your own data. You find it by simply dividing your number of successes by the total sample size (x/n).
- p₀ (p-naught): This is the hypothesized proportion. It's the established benchmark, historical value, or claim from your null hypothesis that you're testing against. It's the "status quo".
- n: This is your sample size. It's just the total number of individuals or items in the group you studied.
Once you have these three numbers, you’re ready to roll.
The Four Steps to Calculation
Running the test yourself follows a clear four-step path. The best way to learn is by doing, so let's use a common business scenario to see it in action.
Imagine a marketing team has been living with a 15% email open rate for years. They want to see if a new, punchier subject line can finally move the needle. They send it out to a random sample of 500 subscribers, and 90 people open the email.
1. State Your Hypotheses
First things first, you need to formally state what you're trying to prove.
- Null Hypothesis (H₀): The new subject line does nothing. The open rate is the same as the old benchmark (p = 0.15).
- Alternative Hypothesis (H₁): The new subject line works! The open rate is higher than the old benchmark (p > 0.15).
2. Check the Conditions
Before you jump into calculations, you have to make sure this is even the right test to use. Think of it as a pre-flight checklist for your data.
Ensure your data is unbiased and your sample is large enough for the math to be reliable. Let’s check them for our email example:
- Random: The problem states it was a random sample of subscribers. So far, so good.
- 10% Condition: Are 500 subscribers less than 10% of the company's total email list? It’s very likely. We'll assume yes.
- Large Counts: We need to have at least 10 expected "successes" and 10 expected "failures".
- Expected successes = n * p₀ = 500 * 0.15 = 75. That's greater than 10.
- Expected failures = n * (1-p₀) = 500 * 0.85 = 425. Also much greater than 10.
We’ve passed all the checks. The coast is clear to proceed.
3. Calculate the Test Statistic
Now for the main event. We just need to plug our numbers into the z-statistic formula.
- p̂ = 90 / 500 = 0.18 (This is our observed open rate)
- p₀ = 0.15 (This is the benchmark we're testing against)
- n = 500 (Our sample size)
Plugging these in, we get: z = (0.18 - 0.15) / √((0.15 * (1 - 0.15)) / 500) ≈ 1.88
What does this actually mean? A z-statistic of 1.88 tells us that our observed open rate of 18% is 1.88 standard deviations above the hypothesized rate of 15%. It’s a standardized score that tells us just how unusual our result is, assuming the null hypothesis is true.
4. Find and Interpret the P-Value
The final step is translating that z-statistic into a p-value, which represents the probability of seeing a result this extreme (or more extreme) purely by chance.
Using a standard z-table or any statistical software, a z-score of 1.88 for a one-tailed test gives us a p-value of roughly 0.03.
Since our p-value (0.03) is less than the typical significance level (alpha = 0.05), we have enough evidence to reject the null hypothesis. The results are statistically significant! It looks like that new subject line really did make a difference.
When you're dealing with larger datasets for tests like this, keeping your numbers organized is half the battle. If you're working in a spreadsheet, check out this guide on how to transpose data from columns to rows in Excel for some helpful tips.
Interpreting Your Results for Actionable Insights
You've done the heavy lifting and calculated your 1 proportion z-test. Now you’re staring at two numbers: a z-statistic and a p-value. This is the moment of truth, where the math transforms into a clear, confident decision.
Your entire decision comes down to one simple comparison: is your p-value smaller than your significance level, or alpha (α)? Alpha is the line in the sand you draw before you run your test. It's your risk tolerance. Most of the time, you'll see this set at 0.05.
Here's a simple way to think about it: Your p-value is the probability that you'd get your sample's results just by random chance, assuming the original claim (your null hypothesis) is true. If your p-value is tiny, say 0.03, it means there's only a 3% chance of seeing what you saw if the null hypothesis were correct. That’s a pretty big coincidence, right?
This leads you to one of two conclusions. It's that simple.
- If p < α: You reject the null hypothesis. The evidence is strong enough to declare your finding statistically significant.
- If p ≥ α: You fail to reject the null hypothesis. The evidence is weak, and your result could easily be a random fluke.
Turning Interpretation into Business Decisions
Let's circle back to our marketing team. They tested a new email subject line, hoping to beat their old benchmark open rate of 15%. Our test gave them a z-statistic of 1.88 and a p-value of 0.03.
Because 0.03 is less than our alpha of 0.05, we get to reject the null hypothesis.
The action here is obvious: The new subject line is a winner. The team now has solid proof that the improved open rate isn't just a fluke. They can confidently roll out the new subject line to their entire audience.
But what if the p-value had been 0.12 instead? In that case, 0.12 is greater than 0.05, so we would fail to reject the null. This doesn't prove the old 15% rate is correct. It just means we don't have enough evidence to say the new one is definitively better. The action? It's back to the drawing board for a new subject line idea.
- Actionable Insight: Don't just report "significant" or "not significant". Translate the p-value into a business risk. A p-value of 0.04 means there's a 4% chance you're wrong to celebrate. A p-value of 0.06 means there's a 6% chance you're wrong to give up. Frame your recommendation in terms of this risk. Is the business willing to take a 6% chance of missing out on a real improvement? This turns a statistical finding into a strategic conversation.
Knowing how to explain these outcomes is just as important as calculating them. Your ability to translate "p < 0.05" into a compelling business case is what makes analysis so valuable. This is the core of effective data storytelling for analysts.
Practical Examples of the 1 Proportion Z Test in Action
The theory is one thing, but seeing how a statistical test works in the real world is where it really clicks. The 1 proportion z-test isn't just for textbooks; it’s a powerful tool that people in different roles use every day to turn data into confident decisions.
Let's walk through a few common business scenarios to see it in action.
In each case, we start with a simple question and use the test to find a clear, actionable answer.
Product Management: Validating Feature Adoption
Imagine you’re a product manager who just launched a big new feature. The team’s goal is to get an adoption rate of at least 30% in the first month. After 30 days, you check a random sample of 400 active users and see that 132 of them have tried the feature.
So, did you hit the target?
- Hypotheses: You set up your null hypothesis (H₀) as "the adoption rate is 30% or less" (p ≤ 0.30) and your alternative (H₁) as "the rate is greater than 30%" (p > 0.30).
- The Numbers: Your sample proportion (p̂) is 132/400, which comes out to 0.33. When you run the numbers, you get a z-statistic of about 1.31 and a p-value of 0.095.
- The Verdict: That p-value (0.095) is higher than the standard 0.05 significance level. This means you can't reject the null hypothesis. Even though 33% sounds better than 30%, it's not a statistically strong enough signal to declare victory.
Actionable Insight: Don't just stop at "we didn't hit the goal". The result means the 3% lift you observed could easily be random noise. The actionable step is to investigate why adoption is lagging. It's time to launch a qualitative study, like user interviews or surveys, to understand the barriers. Is the feature hard to find? Is the value not clear? The z-test told you what happened; now you need to find out why.
Human Resources: Evaluating a Wellness Program
An HR department introduces a new wellness program hoping to curb employee absenteeism. Historically, the company's absenteeism rate sits at 5%. Six months into the program, an HR analyst pulls a random sample of 1,000 employee records and finds 38 missed days. That's a new absenteeism proportion of 3.8%.
The question is, did the program actually work?
- Hypotheses: Here, the null hypothesis (H₀) is that the rate is still 5% or higher (p ≥ 0.05). The alternative (H₁) is that the rate has dropped below 5% (p < 0.05).
- The Numbers: The sample proportion is 0.038. This gives you a z-statistic of roughly -1.75 and a p-value of 0.04.
- The Verdict: With a p-value of 0.04, which is less than the 0.05 alpha, the analyst can confidently reject the null hypothesis. The program has made a statistically significant dent in absenteeism!
Actionable Insight: The result is significant. The next step is to quantify the business impact. Calculate the cost savings from the reduced absenteeism (e.g., (5% - 3.8%) * 1000 employees * average daily cost). This turns a statistical finding ("p < 0.05") into a compelling financial argument ("The wellness program saved the company an estimated $X in productivity"), justifying the program's budget and supporting a wider rollout.
Manufacturing: Monitoring Defect Rates
Over in manufacturing, a team lead tweaks a process to cut down on product defects. The absolute limit for defects is 1%; anything more forces a costly shutdown of the production line. A quality inspector takes a random batch of 2,500 units and discovers 30 defects.
Should they sound the alarm?
- Hypotheses: The null hypothesis (H₀) is that the defect rate is at or below the 1% threshold (p ≤ 0.01). The alternative (H₁) is that the rate has climbed above 1% (p > 0.01).
- The Numbers: The sample proportion of defects is 30/2500, which is 0.012 or 1.2%. This calculates out to a z-statistic of approximately 1.01 and a p-value of 0.156.
- The Verdict: A high p-value like 0.156 means there’s no real evidence that the defect rate has significantly crossed the 1% line. Production can continue.
Actionable Insight: "No significant evidence" is the key phrase. This doesn't mean the rate is perfectly fine; it means you can't be sure it's bad. The actionable step is to increase monitoring frequency. Instead of stopping the line, the team should implement more frequent sampling over the next few shifts. This allows them to catch a real trend if it emerges, without the high cost of a premature shutdown. Knowing how to apply the 1 proportion z-test is a critical skill for anyone in a quantitative role; an AI Research Data Analyst can be a huge help in managing and making sense of this kind of data.

Common Questions about the 1-Proportion Z-Test
Once you've got the hang of the one-proportion z-test, the real challenge begins: knowing when not to use it. It’s a fantastic tool, but it's built for a very specific job. Using it in the wrong situation can lead you down a completely wrong path.
Think of it like a Phillips head screwdriver—invaluable for Phillips head screws, but useless for a flathead. Let's clear up some of the most common mix-ups so you can always choose the right statistical tool for your analysis.
One-Proportion vs. Two-Proportion Z-Test: What's the Difference?
This is easily the most frequent point of confusion, but the distinction is actually pretty straightforward. It all boils down to how many groups you're looking at.
- 1-Proportion Z-Test: You use this when you have a single sample and you want to see how it stacks up against a known number or a pre-existing claim. It’s your group versus a benchmark. For example, testing if your website's conversion rate (one group) is better than last year's average of 3%.
- 2-Proportion Z-Test: This is your go-to when you have two separate, independent samples and you want to compare them directly to each other. It’s a head-to-head battle. For instance, you A/B test a new landing page and compare the conversion rate of Design A (Group 1) against the conversion rate of Design B (Group 2).
Actionable Insight: Just ask yourself what question you're trying to answer. Is it "Is my group different from this target?" That's a one-proportion test. Is it "Is Group A different from Group B?" That's a two-proportion test. Getting this right from the start prevents you from running a complex A/B test analysis when all you needed was a simple benchmark comparison, or vice-versa.
What if My Sample Size Is Too Small?
The one-proportion z-test has a critical dependency: it leans on the normal approximation, which only works if your sample is big enough. The rule of thumb here is the "Large Counts Condition". You need at least 10 expected successes and 10 expected failures. In math terms, that’s np ≥ 10 and n(1-p) ≥ 10.
If your sample is too small to pass this check, the z-test will give you unreliable results. This often happens when you're studying rare events.
Let's look at an practical example: Imagine you’re a hospital administrator testing if a new procedure reduces a very rare complication rate, which historically is 2%. You check a sample of 100 patient records.
- Expected successes (complications): 100 * 0.02 = 2
- Expected failures (no complications): 100 * 0.98 = 98
Because the number of expected complications is only 2 (which is way less than 10), the Large Counts Condition fails. You can't use a z-test here.
Actionable Insight: Don't use the z-test. Instead, use an exact binomial test. This test doesn't need to approximate anything; it calculates the probability directly using the binomial distribution. It's perfectly accurate for small samples and is the right tool for this job. Most statistical software (including R, Python, and even some Excel add-ins) will let you perform this test easily. Knowing when to switch from a z-test to a binomial test is a sign of a sharp analyst.
Can I Use This Test for Continuous Data?
No, and this is a big one. The one-proportion z-test is exclusively for categorical data—information that fits neatly into distinct buckets.
Basically, if your data answers a yes/no question, you're in the right ballpark:
- Did the user subscribe? (Yes/No)
- Was the email opened? (Opened/Not Opened)
- Is the part defective? (Defective/Not Defective)
If your data is continuous, meaning it can be any number within a range (like temperature, height, weight, or revenue per user), you need a completely different test. To compare the average of a single group against a known value, you'd most likely use a one-sample t-test. Trying to run a proportion test on something like average customer spend would give you pure nonsense.
- Practical Example: You want to know if the average purchase amount on your site this month is greater than last year's average of $50. You collect a sample of 100 orders. The data is continuous (e.g., $25.50, $83.10, $49.99). Using a 1-proportion z-test here is incorrect. You would use a one-sample t-test to compare the mean of your sample to the $50 benchmark.
Ready to master the skills that turn data into decisions? At Uplyrn, we provide courses designed by industry experts to help you build a strong foundation in statistics, data analysis, and more. Start your learning journey today.


Leave your thoughts here...
All Comments
Reply