Business Intelligence Training Online: Your Data Career Path

Diving into business intelligence training online is one of the smartest investments you can make in your career. It’s all about learning how to turn messy, raw data into clear signals that businesses can act on. Mastering tools like Power BI and Tableau through these courses makes you a huge asset in any company that wants to be data-driven.
Jump To Section

Earn As You Learn
Earn 25% commission when your network purchase Uplyrn courses or subscribe to our annual membership. It’s the best thing ever. Next to learning,
of course.
Why Business Intelligence Training Is Your Next Smart Move
Think of Business Intelligence (BI) as a company's command center. It takes in all the complex signals—sales numbers, customer reviews, supply chain hiccups—and translates them into a clear picture of what's happening and what to do next. In today's world, BI isn't just another department; it's the engine that powers smarter and faster decisions.
Getting these skills under your belt is a massive career booster. There’s a huge demand for people who can spot hidden trends in data, point out where a business is wasting money, and even predict what the market will do next.
This isn't just a hunch; the numbers back it up. The global BI software market was valued at $31.98 billion in 2024 and is expected to explode to $63.20 billion by 2032. That's a lot of growth and a lot of opportunity.
From Raw Data to Competitive Advantage
A BI professional does way more than just make pretty charts. They build the entire system that delivers those game-changing insights. For instance, a retail analyst might use BI to create a live dashboard showing which products are flying off the shelves in different regions. That allows inventory managers to restock before they run out, not after.
This is exactly why businesses are willing to pay top dollar for these skills. To really make an impact, you need to understand and apply the latest business intelligence best practices. When you sign up for business intelligence training online, you’re not just learning software—you're learning how to turn data into a powerful strategic weapon.
The Power of Accessible Online Learning
Not too long ago, picking up these kinds of specialized skills meant a huge commitment of time and money, often through traditional university programs. But online training has completely changed the game. Now, high-demand BI expertise is within reach for just about anyone.
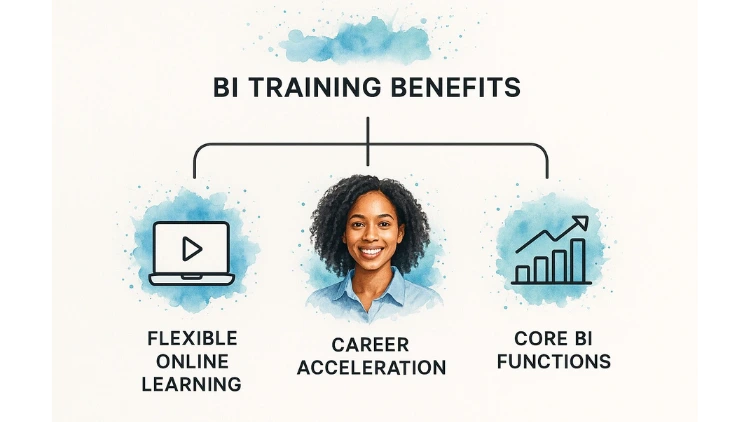
This infographic breaks down exactly why online BI training is such a great move.
As you can see, the flexibility of online learning is a perfect match for professionals looking to grow. It makes it so much easier to get a handle on core BI skills without putting your life on hold. If you are an HR professional, you might be interested in the benefits of investing in employees and how it drives company-wide success.
At its core, business intelligence is about empowerment. It gives teams at every level the data they need to answer critical questions: "Which marketing campaigns are working?" "Where can we cut costs?" "What do our best customers have in common?"
Charting Your Learning Journey: From Beginner to Pro
Becoming a BI pro doesn't happen overnight. It's a journey—one that’s best tackled with a clear map in hand. Think of your business intelligence training online as a structured roadmap, guiding you from the absolute basics all the way to specialized, high-impact skills.
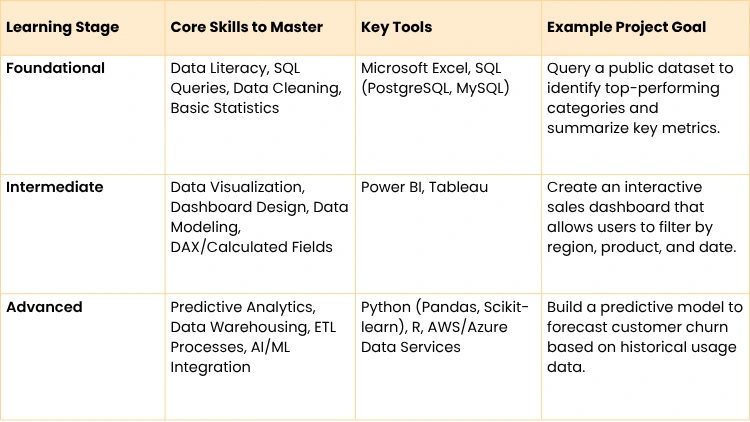
This path is designed to build your expertise layer by layer. You'll start with the fundamentals, move on to mastering the tools of the trade, and finally, learn how to innovate with advanced techniques. Each step builds on the last, giving you a rock-solid and comprehensive skillset.
The Foundational Stage: Building Data Literacy
Before you can create those jaw-dropping dashboards, you need to learn the language of data. This first stop is all about data literacy—understanding how to "speak" to databases and grasp the core principles that underpin all of BI. This stage is non-negotiable.
Your top priority here is mastering SQL (Structured Query Language). It’s the universal key that unlocks data from virtually any database. You'll also dust off tools you might already know, like Microsoft Excel, and push them to their limits for cleaning, sorting, and prepping data for analysis.
Practical Example: Grab a public dataset of city bike-share trips. Use SQL to answer: Which routes are most popular on weekends versus weekdays? This simple query provides an actionable insight for optimizing bike distribution. This is how you build real confidence and make the theory stick.
The Intermediate Stage: Mastering BI Platforms
Once you’re comfortable talking to data, it’s time to give it a voice. In this stage, you’ll master a dedicated BI platform to turn raw numbers into compelling visual stories that actually drive business decisions. The two giants in this arena are Power BI and Tableau.
The goal here is to get really good with one of these tools. You'll learn how to connect different data sources, build interactive dashboards, and design reports that are both beautiful and packed with insight. This is where you’ll learn the art of data visualization—knowing exactly when a bar chart tells a better story than a line graph.
Practical Example: Using e-commerce sales data, build a Power BI dashboard with a map visual showing sales by state and a slicer to filter by product category. An actionable insight could be: "Sales for 'Outdoor Gear' are 40% higher in western states, suggesting a targeted regional marketing campaign."
The Advanced Stage: Specializing and Innovating
This is where you graduate from a skilled analyst to a strategic data professional. The final leg of your journey involves diving into specialized topics that set you apart from the crowd and command a higher salary.
Here, you'll want to focus on skills like:
- Predictive Modeling: Using languages like Python or R to see into the future and forecast trends.
- Data Warehousing: Understanding the architecture behind how massive companies store and manage their data.
- AI and BI Integration: Weaving artificial intelligence into your work to automate insights and build smarter analytics.
An advanced project might involve building a model that predicts which customers are likely to cancel their subscriptions or designing a new data warehouse from scratch for a fast-growing startup. Staying on top requires a commitment to continuous learning, so it's critical to know how to learn effectively in the flow of work and keep adding new skills to your arsenal.

Mastering the Core Skills of a BI Analyst
Great business intelligence training online does more than just show you how to click buttons in a specific software. It’s about building a versatile toolkit of core skills that let you solve real, messy business problems. This is what separates someone who just makes dashboards from a strategic expert who actually drives decisions.
And these skills are needed now more than ever. Even with a huge demand for BI, companies are struggling to find people who can actually do the job. IBM figures this global talent shortage will hit 4.3 million by 2025. That gap is exactly why online training has exploded, focusing on building these specific, high-demand skills. You can explore detailed business intelligence statistics to get a better sense of this trend.
So, let's break down the five pillars of BI expertise every top-tier analyst needs to have.
Data Visualization and Reporting
At its core, BI is all about communication. Data visualization is the art of turning dense, complex data into a clear, compelling story that anyone—from the CEO to a marketing coordinator—can grasp in seconds. This isn't about making charts look pretty; it's about making them deliver an "aha!" moment.
- Practical Example: A retail company is launching a new product. Instead of a spreadsheet, the BI analyst builds a live dashboard. A map shows sales hotspots, a bar chart compares performance against targets, and a line graph tracks customer sentiment from social media.
- Actionable Insight: The CEO sees high sales in a new region but low social media sentiment, prompting an immediate investigation into local marketing messages.
SQL for Data Extraction
Before you can visualize any data, you have to get your hands on it. SQL (Structured Query Language) is the universal key to unlocking databases. It’s the absolute essential skill for pulling, filtering, and organizing the exact information you need from massive data warehouses.
- Practical Example: A marketing manager wants to know the lifetime value of customers acquired through a specific campaign. Using SQL, you can join customer, orders, and campaign tables to pull the exact data needed.
- Actionable Insight: The SQL query reveals that customers from the "Summer Sale" campaign have a 30% higher lifetime value, guiding future budget allocation. If you want to dig deeper, this guide on SQL the unsung warrior of data analytics explains why it’s so foundational.
ETL and Data Preparation
Let's be honest: raw data is almost always a mess. It's incomplete, full of errors, or just plain inconsistent. The ETL (Extract, Transform, Load) process is the critical, behind-the-scenes work of cleaning and structuring all that raw data so it’s actually usable for analysis. This is where you remove duplicate entries, standardize formats (like changing "USA" and "U.S.A." to "United States"), and load it all into a central data warehouse.
Think of ETL as a chef prepping ingredients before cooking. Without proper washing, chopping, and organizing (the transformation), the final dish (your analysis) is going to be a disaster, no matter how good the recipe is.
Data Modeling
Data modeling is where you become the architect of your data. It’s all about designing how data is stored and how different data tables relate to each other. A solid data model is fast, efficient, and makes building accurate reports a hundred times easier.
- Practical Example: For an e-commerce site, a good model would logically connect customers, orders, and products tables. This allows you to easily analyze which customer segments buy which products, an impossible task if the data were stored in one giant, messy table.
Statistical Analysis
Finally, statistical analysis is what lets you find the signal in the noise. This is the skill that takes you from seeing what happened to understanding why it happened. It’s about applying statistical concepts to spot trends, test ideas, and uncover patterns that aren't obvious on the surface.
- Practical Example: A BI analyst might use regression analysis to determine that for every $1,000 increase in social media ad spend, website traffic increases by 2.5%.
- Actionable Insight: This provides a clear ROI, allowing the marketing team to build a data-driven case for a larger budget.

How to Choose the Right Online BI Training Program
With a sea of options for business intelligence training online, picking the one that actually fits your goals can feel overwhelming. But making the right choice is critical—it’s the difference between landing a job with real skills and just passively watching a few tutorials. A little bit of a structured approach can help you cut through the marketing fluff and find a program that delivers serious value.
The secret is to look beyond the flashy promises and size up a course on a few core principles. A great program isn’t just about the specific software it teaches; it’s about the depth of the curriculum, the instructor's real-world street cred, and the hands-on projects you'll get to build.
Evaluate the Curriculum and Project Opportunities
First things first: get your hands on the syllabus and really dig in. Does it cover the full BI lifecycle, from wrangling data with SQL to designing advanced dashboards? A well-designed curriculum should move you logically from basic building blocks to complex, practical applications. Steer clear of courses that only skim the surface.
Just as important are the hands-on projects. Theory is great, but applying what you learn is where the magic happens.
- Look for capstone projects: Does the program end with a substantial project that simulates a real-world business problem? This is your golden ticket to building a portfolio.
- Assess project relevance: Are the projects just generic busywork, or do they challenge you to answer specific business questions, like figuring out why customers are leaving?
- Verify data sources: A quality program will give you clean, interesting datasets to work with or, even better, teach you how to source and prep your own.
Actionable Insight: Before enrolling, find a program graduate on LinkedIn and ask to see their capstone project. This gives you a tangible example of the skill level you can expect to achieve. An employer will always be more impressed by a sharp, well-executed dashboard analyzing sales trends than a simple course completion badge.
Assess Instructor Credibility and Community Support
The person teaching the course can make or break your experience. You want to learn from trainers who have spent years in the trenches as BI analysts or data architects.
Actionable Insight: Before you commit, search for the instructor's name on LinkedIn or Twitter. Have they worked at companies you respect? Do they share practical advice and interact with the BI community? An instructor with real-world experience provides priceless context you’ll never find in a textbook.
Another factor that’s easy to overlook is the student community. A top-tier program will have an active forum or Slack channel where you can ask questions and get feedback. That support system is a lifeline, especially when you’re learning at your own pace. Learning is just more effective—and a lot more fun—when you aren't going it alone. As you look at different platforms, it helps to be familiar with the best practices for distance education to make sure you're signing up for a truly supportive learning environment.
Building a Portfolio That Gets You Hired
You’ve finished your business intelligence training online, which is a huge accomplishment. But here’s the thing: a powerful portfolio is what truly opens doors. This is your chance to build tangible projects that prove to recruiters you can deliver real business value.
Your portfolio is the bridge between your training and your career—it's where you make your new skills visible and practical. So, instead of just saying you know how to build a dashboard, you can show a fully interactive one that answers a compelling business question.
The first step? Finding the right data. The web is overflowing with high-quality, public datasets perfect for BI projects.
- Kaggle: This is a data science community goldmine, packed with diverse datasets.
- Government Portals: Sources like data.gov offer massive datasets on everything from health to transportation.
- Google Dataset Search: A search engine built specifically to find datasets.
Framing Your Project Like a Pro
Once you've got your data, don't just jump in and start building random charts. The best portfolio projects always start with a clear business problem. You want to frame your analysis as if you were a consultant hired to solve a specific challenge.
- Practical Example: You've downloaded an e-commerce sales dataset. Instead of a generic sales report, frame it with a specific goal.
- Project Goal: Analyze customer purchasing behavior to identify distinct segments and recommend targeted marketing strategies to increase repeat purchases.
See the difference? This approach immediately shows you have business acumen. It proves you're thinking beyond the raw data and focusing on driving real outcomes, which is exactly what employers are desperate to see.
Actionable Insight: For each portfolio project, write a one-paragraph summary that follows this structure: 1. The Problem: What business challenge were you addressing? 2. The Process: What tools and techniques did you use? 3. The Solution: What were your key findings and actionable recommendations? This frames your work perfectly for recruiters.
Sharing Your Work and Getting Noticed
Your completed projects are powerful assets, but only if the right people see them. Sharing your work on professional platforms turns your learning journey into a dynamic career-building machine. GitHub is an excellent spot to host your project files and document your entire analytical process.
Then, you can write a compelling post on LinkedIn to showcase your final dashboard and insights to a wide network of recruiters and hiring managers.
As you build out your portfolio, you also need to nail your online professional presence. It’s crucial to discover effective general profile optimization strategies to make sure your profiles on sites like LinkedIn are sharp and compelling.
A fantastic portfolio, paired with a killer resume, is a winning combination. This guide on how to write a resume that will actually get a recruiter's attention gives you actionable tips to tie it all together perfectly.

Your Career in the Future of Business Intelligence
Finishing your business intelligence training online is a huge accomplishment, but it's really just the starting line. The world of data doesn't sit still. The tools and techniques you master today are constantly changing, and the secret to a long, successful career is staying just ahead of that curve.
The future of BI is dynamic, shaped by trends like AI and machine learning. These technologies are fundamentally shifting BI from a rearview mirror that explains what happened to a crystal ball that helps predict what will happen next.
Key Trends Shaping the Future of BI
One of the biggest shifts is the explosion of self-service BI. This is all about putting the power of data into the hands of people across the entire organization, not just data specialists.
Modern platforms like Power BI and Amazon QuickSight are now embedding generative AI.
- Practical Example: A marketing manager can type "Compare Q3 sales for new products versus last year" and instantly get a chart, without needing to file a ticket with the BI team.
This changes your role for the better. You get to move from being a report-builder to a strategic guide, helping your colleagues ask the right questions and ensuring the data they’re using is solid and secure.
The next decade of business intelligence won't be about who can build the most complex report. It will be about who can enable the most people to make smarter, data-driven decisions on their own.
Staying Ahead with Continuous Learning
Your training gives you a rock-solid foundation, but you have to keep building on it. To make sure your skills stay sharp and in-demand, you need to be proactive. Here are a few practical ways to stay on top of the changes:
- Follow Industry Leaders: Find BI experts and influencers on LinkedIn. See what new tools they're testing and what new techniques they're talking about.
- Participate in Communities: Jump into online forums or user groups for tools like Tableau or Power BI. There's no better place to learn from your peers.
- Pursue Specialized Credentials: Once you have your footing, think about getting certified in high-growth areas like cloud platforms (AWS, Azure) or advanced analytics.
Actionable Insight: Dedicate 30 minutes every Friday to "play" with a new feature in your BI tool of choice or read one article about an emerging data trend. This small, consistent habit keeps you ahead of the curve without being overwhelming.
Common Questions About Business Intelligence Training
If you're just starting to explore a career in BI, you've probably got a few questions. Getting clear answers is the first step to picking the right business intelligence training online. Let's walk through some of the most common questions.
How Long Does It Take To Learn BI Fundamentals?
You can get a solid handle on the fundamentals of BI in about 3 to 6 months of dedicated learning. That's a realistic timeframe to get comfortable with core skills like SQL, data cleaning, and using a major tool like Power BI or Tableau.
But here’s the thing: learning BI isn't a race with a finish line. It's more like learning a language. You can become conversational in a few months, but true fluency comes from using it every day.
Actionable Insight: The people who learn fastest are the ones who get their hands dirty with data consistently. Spending an hour a day analyzing a new dataset will build your skills much faster than binge-watching tutorials on a weekend.
Do I Need a Tech Background?
Absolutely not. In fact, some of the best BI professionals we know came from backgrounds in business, finance, and marketing. They succeeded because the best online courses aren't built for coders; they're designed for problem-solvers.
- Practical Example: A former marketing coordinator uses their industry knowledge to analyze campaign data and discovers that email click-through rates are highest on Tuesday mornings. Their business context is what made the data valuable. The technical skills are just the tools you use to find the answers.
Power BI or Tableau: Which Should I Learn First?
This is the classic question, and honestly, you can't go wrong with either. They're both fantastic tools. The right choice for you really boils down to your career goals.
Power BI is an absolute beast inside companies that already run on the Microsoft ecosystem. Tableau is famous for its beautiful, intuitive interface and its incredible data visualization capabilities.
Actionable Insight: Go to LinkedIn Jobs and search for "BI analyst" roles in your target city. Tally the results. If 70% of listings mention Power BI, that's a strong market signal telling you where to start.
Is a BI Certification Really Worth It?
A certification can definitely be valuable. It's a clear signal to recruiters that you've put in the work and have a baseline level of competence, which can help your resume get noticed.
But a certificate alone won't get you the job. Its real power is unlocked when you pair it with a strong portfolio of projects. A recruiter wants to see proof that you can actually do the work.
A certificate says you've learned. A project that analyzes real sales data to uncover new growth opportunities proves you can deliver value.
Ready to stop just thinking about it and start building the skills that will actually get you hired? At Uplyrn, our expert-led courses do more than just teach you theory—they turn you into a data-driven professional. Explore our programs and start your journey today.


Leave your thoughts here...
All Comments
Reply