How to Learn Data Analytics: A Guide for Real-World Success

So, you want to learn data analytics? It's all about turning messy numbers into clear, powerful business decisions.
There’s a proven path that works, and it doesn't involve jumping straight into the most complex tools. The journey starts with spreadsheets like Excel or Google Sheets, moves on to mastering SQL for databases, and then layers on a programming language like Python and a visualization tool like Tableau. Following this sequence builds a rock-solid foundation for a successful career.
Jump To Section

Earn As You Learn
Earn 25% commission when your network purchase Uplyrn courses or subscribe to our annual membership. It’s the best thing ever. Next to learning,
of course.
Your Starting Point in Data Analytics
Welcome to the world of data analytics—a field where your curiosity can have a real impact. Before you get lost in a sea of tools and jargon, it’s crucial to understand what a data analyst actually does.
At its core, the job is about collecting, cleaning, and interpreting data to answer important business questions and guide strategy. Think of it as being a detective for the business.
- Practical Example: Imagine a retail company trying to figure out why sales dipped last quarter. An analyst would dig into sales records, customer feedback, and market trends. They'd clean up all that raw information, hunt for patterns, and might discover the cause was a new competitor or a poorly performing marketing campaign.
- Actionable Insight: The analyst wouldn't just report the "what" (sales are down); they would provide the "why" (a new competitor's promotion is drawing customers away) and suggest a "next step" (launching a counter-promotion targeting loyal customers). That's the essence of the job: telling a compelling story with data that leads to a decision.
The Modern Learning Path
In the past, the road to becoming a data analyst felt a bit like the Wild West—unstructured and confusing. Thankfully, things are much clearer now. The most effective way to learn is by layering skills logically, starting with accessible tools before moving on to more powerful ones.
This progression makes the whole process feel less overwhelming.
- Step 1: Spreadsheets
- Step 2: SQL
- Step 3: Python/Tableau
This path is popular for a reason: it works. You build confidence with spreadsheets, gain serious data-handling power with SQL, and then achieve true versatility with programming and visualization. If you want to dig deeper into the different roles in this space, this guide on what is data science and analytics is a great next step.
Why Start Now
There has never been a better time to jump into this field. Seriously. The data analytics market is projected to explode from USD 81.54 billion in 2026 to an incredible USD 236.31 billion by 2032.
That's a compound annual growth rate of 19.2%. This isn't just a passing trend; it reflects a fundamental shift where businesses in every sector are desperate for people who can make sense of their data.
The ultimate goal of a data analyst isn't just to report numbers, but to drive change. Your insights on customer behavior, operational efficiency, or market trends directly influence business strategy and success.
By following the practical Excel -> SQL -> Python/Tableau roadmap, you’re not just learning skills—you’re learning the right skills in the right order. This approach helps you avoid common frustrations and start building a portfolio that shows employers you can deliver real-world value.
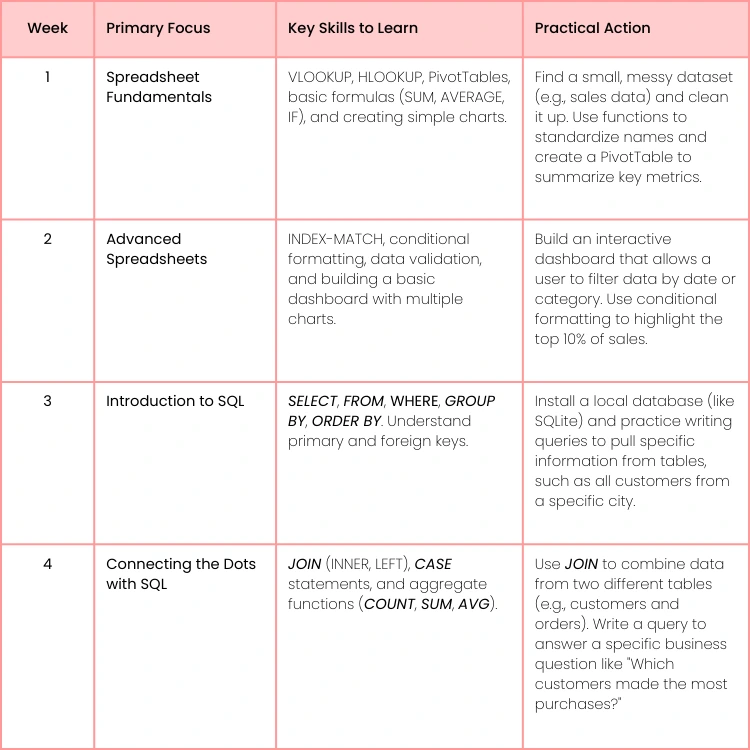
Your Initial 30-Day Data Analytics Learning Plan
Getting started can feel like the hardest part. To give you a clear, actionable goal, here’s a 30-day plan focusing on the absolute essentials. This isn't about becoming an expert overnight; it's about building a strong base.
This one-month sprint will give you a tangible sense of accomplishment and a solid set of skills to build upon.
Building Your Foundational Skillset
Every great analyst started with the same solid fundamentals. Before you even think about complex tools or fancy algorithms, you need to learn the 'why' behind the numbers. That journey begins with two things: basic statistics and the most universal data tool on the planet—the humble spreadsheet.
Think of statistics as the grammar of data. You wouldn't write an essay without understanding sentence structure, right? Same idea here. Concepts like mean, median, and mode are your basic vocabulary for describing a dataset, while standard deviation tells you how much the data varies. These aren't just textbook terms; they give you immediate, practical insights.
Grasping Core Statistical Concepts
Imagine you're handed customer purchase data for an e-commerce site. Your first instinct might be to calculate the mean (average) purchase amount to see how much people are spending. But what if a few corporate clients placed massive orders? Those outliers could skew your average way up, making it look like every customer is a big spender.
In that scenario, the median (the middle value) gives you a much more honest picture of a typical customer. Understanding that distinction is what separates a rookie from a pro.
- Actionable Insight: Instead of just reporting the skewed average, you would report both: "The average purchase is $500, driven by a few large orders, but the median purchase for a typical customer is $50." This provides critical context for marketing decisions. You have to develop strong analytical skills and a sense of curiosity—this is the real engine of data analysis.
Mastering Spreadsheets for Practical Analysis
Next up: getting your hands dirty with spreadsheets. We're talking about Excel or Google Sheets. And no, we don't mean just typing numbers into cells. Your goal is to make the software do the heavy lifting. Functions like VLOOKUP, INDEX-MATCH, and especially PivotTables are absolutely non-negotiable.
Practical Example: Cleaning Sales Data
Here's a classic junior analyst task. You get a monthly sales report, but the data is a mess. Product names are all over the place: "T-Shirt", "tshirt" and "Tee Shirt" are all listed as different items. Your analysis will be junk unless you fix this.
This is where your spreadsheet skills come in:
- VLOOKUP/INDEX-MATCH: You can create a small reference table with the correct product names. Then, use one of these functions to look up the messy names and automatically replace them with the clean ones. It’s like magic.
- PivotTables: Once your data is clean, a PivotTable is your best friend. In literally three clicks, you can summarize total sales by product, region, or date. You can spot your best-selling items or find underperforming stores in seconds.
Actionable Insight: A fantastic exercise is to take a messy dataset and build a simple dashboard with a few charts and slicers. This directly mimics the kind of work you'll be doing and gives you a concrete project for your portfolio. For instance, a slicer for "Region" could instantly show which products are popular in North America versus Europe.
Mastering spreadsheets is about more than just organizing numbers. It's your first real taste of data transformation—turning a messy, raw dataset into a source of clear, actionable business intelligence.
This foundational stage is where you build the muscle memory for wrangling data. While spreadsheets are a powerful start, you'll eventually hit their limits. That's when tools like Python come in for more complex work. If you're already thinking ahead, this guide on how to learn Python programming shows you what that next step looks like.
Alright, with a solid foundation under your belt, it's time to get your hands on the power tools every data analyst needs to know. This is where you graduate from simply organizing data to wielding tools built for serious, large-scale analysis. It's a genuine game-changer.
First up, and arguably the most critical, is SQL (Structured Query Language). Think of SQL as the universal language for talking to databases. Nearly every company you can imagine—from e-commerce giants to local startups—stores its most valuable data in relational databases. Customer info, sales figures, inventory levels... it's all in there. And SQL is your key to unlocking it. This isn't just a suggestion; it's a hard requirement for almost any analytics job out there.
Unleashing Data with SQL
Let's make this real. Imagine you're an analyst at an online retailer, and your boss asks a simple question: "Who are our most valuable customers?" You've got two big tables in your database: one for customer details and another for orders. You can't just eyeball these; you need to bring them together.
Practical SQL Example: Finding Top Customers
This is where you'd write a SQL query. You'd use a JOIN to connect the customers and orders tables on customer_id. Then, you'd use GROUP BY customer_id and SUM(order_total) to add up their spending, and ORDER BY total_spent DESC to sort the list from highest to lowest. In just a few minutes, you’ve answered a critical business question with hard data.
- Actionable Insight: The resulting list could be used by the marketing team to create a VIP loyalty program.
This kind of data manipulation is fundamental. While you can do some neat tricks in a spreadsheet—this guide on how to transpose data from columns to rows shows a few—SQL and Python are built to handle this kind of work at scale.
Automating Tasks with Python and Pandas
Next in your toolkit is Python, specifically with its powerhouse data library, Pandas. If SQL is for getting data, Python is for cleaning, transforming, and automating what you do with it.
- Practical Example: Think about that messy sales report you get every month as a CSV file. Cleaning it up by hand is a total nightmare. But with a Python script using Pandas, you can automate the whole mess. The script can load the file, standardize the column names (e.g., pd.rename), hunt down and remove duplicates (pd.drop_duplicates), and fix date formats (pd.to_datetime)—all in one go. This doesn't just save you hours of mind-numbing work; it guarantees your data is consistent every single month.
The real magic of learning Python for data analytics isn't just about handling bigger datasets. It's about building repeatable, automated workflows. This frees you up to do what you were hired for: finding insights, not just cleaning data.
Telling Stories with Data Visualization
Finally, you have to show people what you found. Raw numbers in a spreadsheet are confusing and, frankly, boring. A sharp, well-designed dashboard, on the other hand, tells a story. This is where data visualization tools like Tableau or Power BI come into play. They let you connect directly to your data and build interactive dashboards filled with maps, charts, and graphs.
- Actionable Insight: Instead of just a bar chart of sales, create a map visualization in Tableau showing sales by state. Color-code the states from red (low sales) to green (high sales). This immediately draws the eye to underperforming regions, providing a clear starting point for a deeper investigation. The ability to create compelling visuals is what elevates your work from a simple report to a powerful decision-making tool.
This is especially true in the most mature job markets. For example, North America currently dominates the data analytics market, holding a 37.6% global share. The heavy concentration of tech companies and rapid cloud adoption has created a hotbed for skilled analysts, with median salaries often topping $100,000 annually. For anyone learning these skills, that presents a massive opportunity. You can discover more insights about the data analytics market here.

Advancing Your Skills with Predictive Analytics
Once you’re comfortable explaining what happened with data, it’s time to level up and start predicting what will happen. This is the exciting world of predictive analytics and machine learning (ML), a skill that shifts you from simply analyzing the past to forecasting the future. It might sound intimidating, but it's a natural and crucial next step in building a long-term data analytics career.
At its core, predictive analytics just means using historical data to spot patterns and make educated guesses about what comes next. It’s a massive growth area, currently commanding 21.73% of the data analytics market and expanding fast thanks to AI and ML. For any aspiring analyst, this is a future-proof skill. In fact, an estimated 80% of businesses are expected to be using predictive analytics by 2026. You can dig into the full research on the growth of the data analytics market.
Supervised vs. Unsupervised Learning
To get started, you'll need to wrap your head around two fundamental machine learning concepts: supervised and unsupervised learning. Don't let the technical jargon throw you off; the ideas are pretty straightforward when you look at them through real-world examples.
- Supervised Learning: Think of this as learning with an answer key. You feed the algorithm "labeled" data, meaning you show it both the input and the correct output. The machine learns the relationship between the two.
- Practical Example: A streaming service wants to predict which customers might cancel their subscriptions ("churn"). They use historical data of past customers—viewing habits, login frequency, and whether they ultimately canceled. The model learns the patterns of churn and can then flag current customers who start showing similar behavior.
- Unsupervised Learning: Here, there’s no answer key. You give the algorithm unlabeled data and ask it to find hidden structures or groups on its own.
- Practical Example: A marketing team has a huge customer database but isn't sure how to segment it. They use an unsupervised algorithm (like K-Means clustering) to group customers based on purchasing behavior, demographics, and website activity. The model might spit out distinct clusters like "Bargain Hunters", "Loyal High-Spenders" and "New Visitors" which the team can then target with specialized campaigns.
The real power here is moving from reactive to proactive decisions. Instead of just reporting on last month's customer churn, you can now identify at-risk customers before they leave, giving the business a chance to step in and save them with a targeted offer.
Your First Predictive Analytics Project
Theory is one thing, but getting your hands dirty is what really matters. A fantastic first project is building a simple linear regression model in Python. This type of model is perfect for predicting a continuous numerical value, like a price or a sales figure.
- Actionable Insight: A Beginner Project. A classic beginner project is predicting flight prices. You can find a dataset that includes variables like:
- Days until departure
- Airline
- Destination city
- Time of day
- Day of the week
Using Python libraries like Scikit-learn, you can train a model to understand how each of these factors influences the final ticket price. This not only gives you a tangible project for your portfolio but also demonstrates a high-demand skill.
- The actionable outcome is a tool that could tell a user, "Booking your flight on a Tuesday, 30 days in advance, is likely to save you 15% compared to booking on a Friday."
Want to see a more advanced application? This guide on predictive classification using logistic regression offers a deep dive into another common ML model. This is the kind of hands-on experience that will truly set you apart from other aspiring analysts.

Building a Job-Winning Data Analytics Portfolio
Let's be blunt: your skills are just theory until you prove you can apply them. A powerful portfolio is that proof. It's what you show a hiring manager to say, "I can actually do this." Think of it as your most important asset, transforming you from an aspiring analyst into a real candidate.
A great portfolio is so much more than a random collection of projects. It's a carefully curated showcase of your problem-solving abilities. It demonstrates that you can take raw, messy data, unearth meaningful insights, and then communicate those findings clearly. This is exactly what employers are desperate to see.
Finding Unique Datasets
To make a real impression, you have to move beyond the tired, overused datasets everyone else is using (I'm looking at you, Titanic passenger list). You need data that lets you answer interesting, non-obvious questions. Find something that genuinely sparks your curiosity and connects to the real world.
Here are a few excellent places to hunt for compelling data:
- Government Open Data Portals: Sites like Data.gov in the US, or even your local city’s open data portal, are treasure troves. You can find rich datasets on public transit, crime rates, or housing permits.
- Actionable Idea: Analyze public transit data to identify the busiest routes and suggest where new express bus services could be added to reduce commuter times.
- Kaggle Datasets: While famous for its competitions, Kaggle also hosts thousands of user-contributed datasets on every topic imaginable, from e-commerce transactions to video game sales.
- Sports Statistics APIs: Many sports leagues offer APIs bursting with detailed game-by-game statistics. Digging into player performance or team trends is a fantastic and fun way to demonstrate your skills.
The secret ingredient here is passion. If you pick a topic you truly care about, that enthusiasm will shine through in your analysis and storytelling.
Three Portfolio Project Ideas to Get You Started
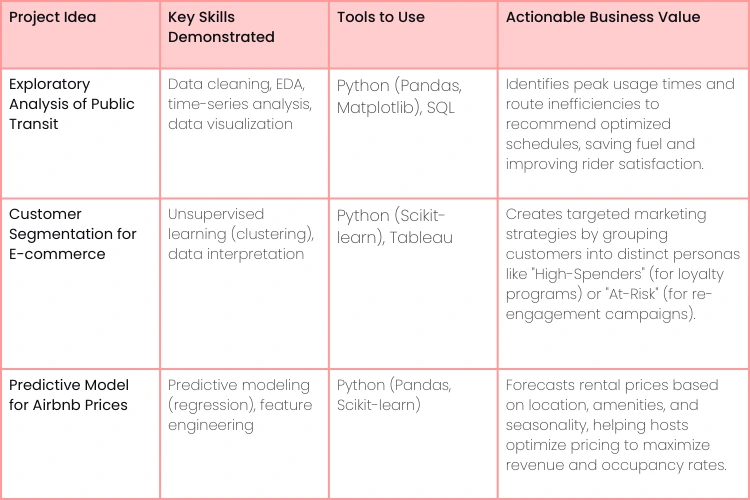
Your goal should be to demonstrate a range of skills, not just one. Instead of tackling three similar projects, aim for variety. The table below gives you three distinct project ideas that highlight different analytical capabilities and show potential employers the value you can bring.
Data Analytics Portfolio Project Ideas
A great portfolio showcases a variety of skills. Here are three project ideas designed to demonstrate your range, from exploratory analysis to predictive modeling, and how each translates into real business value.
As you can see, each of these projects forces you to answer a specific, practical question. For instance, with the customer segmentation project, you’re not just clustering data for the sake of it; you’re giving a marketing team actionable groups like "High-Value Frequent Shoppers" or "One-Time Bargain Hunters".
Your thought process is as important as the final output. Documenting your work on GitHub or a personal blog shows employers how you think, which is often more valuable than just seeing a finished dashboard.
Make sure to explain your assumptions, why you chose a particular model, and what you'd investigate next if you had more time or data. This narrative is what truly demonstrates your business acumen and critical thinking.
Finally, remember your portfolio is just one piece of the job-seeking puzzle. A killer portfolio needs a killer resume to get noticed. Learn how to Unlock Resume Success by focusing on core competencies and modern formatting that beats the bots. For more specific advice, this guide on how to write a resume that will actually get a recruiter's attention is a must-read.
A fantastic portfolio paired with a sharp resume is the one-two punch that truly opens doors.
Common Questions About Learning Data Analytics
When you first start exploring data analytics, it feels like you have a million questions. That's totally normal. Let's cut through the noise and tackle some of the most common ones we hear from aspiring analysts.
How Long Does It Realistically Take?
While some bootcamps make flashy promises about getting you job-ready in 12 weeks, a more practical timeline for someone starting from scratch is anywhere from 6 to 12 months of dedicated learning.
That window gives you enough time to actually build a solid foundation, get comfortable with the core tools, and—most importantly—complete a few portfolio projects that show you can apply what you've learned.
- Actionable Insight: Break down this timeline into smaller goals. Aim to master spreadsheets in month one, become proficient in SQL by month three, and build your first two portfolio projects by month six. This makes the journey feel more manageable. Your own pace will depend on your background, of course. A professional reskilling from a related field might pick things up faster than a complete beginner.
Degree vs. Certification: What Matters More?
The classic debate. The answer is becoming clearer every day: skills and projects matter most. A relevant degree in stats or computer science is great, but it’s definitely not the gatekeeper it once was. Plenty of top-tier analysts are self-taught or got their start with a good certification program.
What hiring managers really want to see is what you can do. A strong portfolio that proves you can solve real-world business problems will almost always speak louder than a diploma.
Hiring managers are on the hunt for "T-shaped" professionals. These are people with a broad understanding of the business (the top of the T) and deep expertise in specific analytical tools (the vertical bar). Simply knowing how to run a SQL query isn't enough; you have to understand why you're running it.
This is where a good certification can give you a real leg up. They offer a structured path and signal to employers that you have a verified skillset in key tools like Power BI, Tableau, or through respected programs like the Google Data Analytics Professional Certificate.
- Actionable Insight: Use a certification not just for the credential, but to build a portfolio piece. Complete the final capstone project with extra care and feature it prominently on your resume and LinkedIn.
How to Stand Out in a Competitive Market
As more and more people jump into data analytics, just knowing the technical stuff isn't enough to make you stand out anymore. You've got to develop the skills that go beyond the code and dashboards.
Here’s what really sets the best candidates apart from the crowd:
- Business Acumen: You absolutely must understand the "why" behind every data request.
- Actionable Insight: Before starting a project, write down two or three business questions you want to answer. For example, instead of just "analyzing sales data", ask "Which marketing channel is bringing in the highest-value customers?" This frames your work around business impact.
- Data Storytelling: Your job isn't to just present charts; it's to build a narrative. You need to explain what the data means, why it matters, and what the next logical step should be. The goal is to translate complex findings into a clear, compelling story for people who aren't data experts.
- Active Networking: Don't just learn in a silo. Jump into online communities, show up at virtual meetups, and start connecting with other analysts on LinkedIn. Share what you're working on, ask for feedback, and build genuine relationships. You'd be surprised how often your next opportunity comes from someone you know.
At the end of the day, becoming a successful data analyst is all about mixing that technical skill with a sharp business sense and killer communication. It’s a journey of constant learning, but with the right approach and a little guidance, it's an incredibly rewarding one.
Ready to build the skills that will actually get you hired? Uplyrn offers a complete ecosystem with expert-led courses and mentorship to guide you every step of the way. Start your data analytics journey today.


Leave your thoughts here...
All Comments
Reply