What is Business Intelligence Analytics Explained for You

Running a business on guesswork is like trying to navigate a ship in a raging storm without a compass. It's risky, inefficient, and you're far more likely to end up on the rocks than at your destination. Business intelligence analytics is that compass. It’s the process of collecting, analyzing, and visualizing data from every corner of your company to turn a sea of complex information into clear, confident actions.
Think of it as a GPS for your business, guiding you past obstacles and toward your goals.
Jump To Section

Earn As You Learn
Earn 25% commission when your network purchase Uplyrn courses or subscribe to our annual membership. It’s the best thing ever. Next to learning,
of course.
The Compass for Modern Business Decisions
To really get started, it's worth taking a moment to clearly define what is business intelligence analytics. At its core, this isn't just about crunching numbers. It's about using those numbers to tell a story—a story that helps you understand not only what happened in the past but also why it happened. This gives you a rock-solid foundation for future strategy.
From Raw Data to Actionable Insights
Business intelligence acts as the essential bridge between overwhelming raw data and strategic clarity. It pulls information from all sorts of places to paint a complete, cohesive picture of your company's performance.
This data comes from sources like:
- Customer Relationship Management (CRM) Systems: Details on customer interactions and sales pipelines.
- Financial Software: The hard numbers on revenue, expenses, and profitability.
- Supply Chain Operations: Information on inventory levels, shipping times, and logistics.
- Website Analytics: Data on user behavior, traffic sources, and conversion rates.
By pulling all this information together, BI analytics helps leaders spot trends, identify nagging inefficiencies, and uncover brand-new opportunities that were previously hidden.
- Practical Example: A retail manager uses a BI dashboard and notices that a particular jacket sells exceptionally well on rainy weekends. This isn't just a fun fact; it's an actionable insight. They can now adjust inventory and run targeted promotions before the next storm hits, directly boosting sales.
This is the real magic of business intelligence. It’s the shift from simply reacting to what happened last quarter to proactively charting a better course forward.
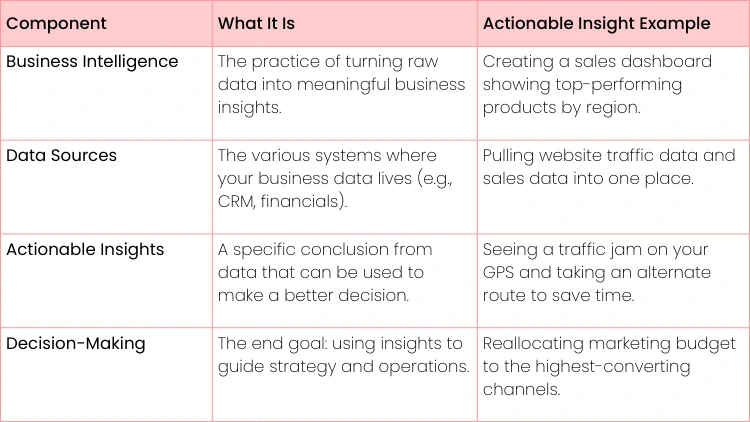
To put it all together, here's a quick summary of the key ideas we've covered.
BI Analytics at a Glance
This table helps illustrate how these different pieces come together to create a powerful system for navigating the business landscape.
How a BI Analytics System Actually Works
Ever wondered how all that raw, messy data floating around a company gets turned into those clean, insightful reports managers love? Think of a BI system like a professional kitchen. It takes a chaotic jumble of raw ingredients (your data) and transforms it into a gourmet meal (actual business insights).
It all starts with gathering the ingredients from different grocery stores. You might grab customer info from your CRM, sales figures from your accounting software, and website clicks from Google Analytics. Each source provides a key component for the final dish. This initial data collection is the first, and arguably most important, step.
The Prep Stage: Making Data Usable
Before any real analysis can happen, that raw data needs to be prepped. In the BI world, this crucial stage is called ETL (Extract, Transform, Load). This is where the magic really starts, turning inconsistent data into something reliable.
- Extract: First, the raw data is pulled from all its different sources. It’s like harvesting vegetables from the garden or grabbing spices from the pantry.
- Transform: This is the most critical part. The data gets cleaned up, standardized, and given a consistent structure.
- Practical example: this is where customer addresses entered as "California", "Calif" and "CA" all become a single standard "CA" ensuring reports are accurate.
- Load: Finally, this newly polished data is loaded into a central, organized repository, which is usually a data warehouse.
Just like a chef meticulously washes, chops, and organizes every ingredient before even thinking about turning on the stove, ETL ensures the final result isn't a mess. Without this prep work, your reports would be completely unreliable. If you want to dig deeper into the databases and query languages like SQL that make this all possible, check out this guide on SQL the un-sung warrior.
This process makes it clear that BI isn't just a one-off task; it's a structured journey that turns raw information into a genuine strategic asset.
From Storage to Storytelling
Once your clean data is sitting in the data warehouse—your perfectly organized pantry—the BI tools take over. Think of tools like Microsoft Power BI or Tableau as your high-tech ovens, mixers, and plating tools. They connect to the warehouse, allowing analysts to slice and dice the data, create compelling charts, and build interactive dashboards.
- Practical Example: An e-commerce manager uses a BI dashboard to track sales in real-time. If they see a sudden spike in purchases from Texas right after launching a local social media campaign, that’s not just data—it’s an actionable insight. They can immediately decide to pump more ad budget into that region to ride the wave and maximize ROI.
It's no surprise that the demand for these systems is exploding. The global BI and analytics market is expected to more than double, growing from $96.6 billion to an estimated $196.5 billion by 2033. This surge is fueled by the simple fact that businesses thrive on data-backed decisions. The entire pipeline, from scattered bits of information to a clear, compelling story on a dashboard, is what makes business intelligence an indispensable part of modern business.
BI vs Data Analytics vs Data Science Explained
It’s easy to see why people use business intelligence, data analytics, and data science interchangeably. They all deal with data, right? But in practice, they are distinct fields that tackle very different business problems.
Getting this right is crucial. Knowing the difference helps you build a solid data strategy and ensures you bring in the right expert for the job.
Let’s try a simple analogy. Think of driving a car:
- Business Intelligence is your dashboard—the speedometer and rearview mirror. It tells you what’s happening right now and what just happened.
- Data Analytics is the mechanic popping the hood to diagnose why the engine is making that weird noise. It’s all about digging into the "what" to find the "why".
- Data Science is the engineering team designing a more efficient engine for next year's model. They use all the available data to predict the future and map out the best path forward.
Answering Different Business Questions
The real distinction comes down to the questions each field answers. This separation helps businesses apply the right tool to the right challenge, moving from simply looking at data to making it drive real outcomes.
To make this tangible, let's imagine a retail scenario:
- Business Intelligence (The "What"): A BI dashboard flags that sales for a popular sneaker dropped by 15% last quarter. This is pure descriptive analytics, presenting the facts in a clear, straightforward way.
- Data Analytics (The "Why"): A data analyst dives in. They might discover a competitor launched a huge marketing campaign at the same time, or that negative online reviews spiked, connecting these events to the sales dip.
- Data Science (The "What's Next"): A data scientist builds a model that forecasts future sales dips based on competitor ad spending. They could even develop a prescriptive model that recommends an automated price adjustment to soften the blow.
Actionable Insight: The magic happens when you see how they all work together. BI spots the problem, analytics figures out the cause, and data science builds a forward-looking solution. This integrated approach allows a business to not only react to issues but to anticipate and prevent them.
The Blurring Lines and What's Ahead
The data world doesn't stand still. We're already seeing the lines between these fields begin to blur as technology gets smarter.
AI-augmented analytics is projected to drive 40% of new BI purchases soon, meaning our reporting tools are getting more predictive. At the same time, data science is becoming more accessible.
Research shows that by 2025, about 33% of large companies will have adopted decision intelligence, signaling a major shift toward smarter, more automated decision-making. If you want to keep up, you can check out the latest business intelligence market analysis to see where things are headed.
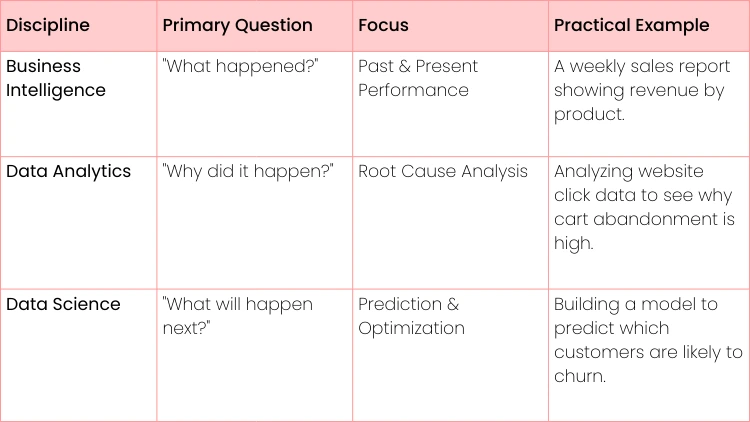
A Quick Comparison
While there's overlap, a side-by-side look makes the core differences pop. The central question each discipline asks really defines its role within a business. You can dive even deeper in this complete guide to what is data science and analytics.
Here’s a table that breaks it down. This table isn't about boxing them in, but about understanding their primary strengths. In reality, a good data professional often wears multiple hats.
Practical Business Applications of BI Analytics
Theory is great, but the real power of business intelligence and analytics shines when you see it in action. It’s not just about making pretty charts; it's about solving tangible business problems and giving every department an edge. From marketing to operations, BI turns data into a practical, everyday tool for making smarter calls.
Think about a marketing team trying to figure out which of their campaigns are actually pulling their weight. Instead of just going with their gut, they can use BI to connect ad spend directly to sales figures, giving them a crystal-clear picture of their campaign ROI.
Driving Results in Marketing and Sales
For marketing departments, BI is the key to unlocking customer behavior. By digging into purchasing history and website engagement, teams can zero in on their most valuable customer segments.
- Practical Example: An e-commerce clothing brand uses its BI dashboard to slice and dice its customer data. They find a specific group of shoppers who only buy sustainable clothing and are happy to pay a premium for it. Armed with this insight, they launch a targeted email campaign for a new eco-friendly line, which results in a 35% higher conversion rate than their usual promotions.
Over in the sales department, BI delivers crucial visibility into performance and new opportunities. Sales leaders can use interactive dashboards to track progress against quotas in real-time, instantly seeing which reps are crushing it and which might need a hand. It’s also fantastic for spotting untapped markets.
- Actionable Insight: A sales team might use a BI map visualization to notice a region with tons of website traffic but surprisingly low conversions. That’s a clear signal to investigate further. The action? Deploy a dedicated local sales rep or launch a region-specific marketing campaign to close the gap.
Optimizing Finance and Operations
The finance team lives and breathes accuracy and foresight, and BI analytics delivers on both fronts. Teams can finally move beyond clunky, static spreadsheets to build dynamic financial models that forecast revenue and expenses with far greater precision. This is a game-changer for functions like risk management—you can learn more about data analytics for risk hedging in this detailed guide.
BI dashboards also let finance managers keep a close eye on departmental spending against budgets in real-time. They can even set up automated alerts to go off when a team is nearing its limit. This proactive approach stops overspending before it starts and tightens up financial governance.
In the world of operations and supply chain, efficiency is king. BI helps managers optimize inventory levels, slash waste, and streamline the entire logistics process.
- Practical Example: A beverage company used BI to correlate its sales data with local weather patterns. They discovered that sales of a particular iced tea shot up in cities where the temperature climbed above 85°F. This allowed them to build a predictive stocking model that cut stockouts by 40% during heatwaves, directly preventing lost revenue.
This kind of versatility is exactly why BI adoption is exploding. The fact is, a staggering 94% of organizations now see it as critical to their success. While the retail sector is a huge growth area, using BI for predictive analytics, the financial services industry remains a major player with its focus on risk analytics and compliance.
These examples make it clear: no matter the department, BI and analytics provide the clarity needed to drive real, measurable results.

Choosing the Right BI Tools for Your Needs
Picking the right business intelligence tool is a lot like choosing a vehicle. You wouldn't take a Ferrari on a rugged camping trip, right? A sports car is built for the track, not the wilderness. In the same way, the "best" BI tool isn't the one with the flashiest features—it's the one that fits your company's unique terrain.
That means matching the tool to your budget, your team's skills, and what you're actually trying to accomplish.
The market is crowded with fantastic options, but they all have their own strengths. Tools like Microsoft Power BI are powerhouses for companies already deep in the Microsoft ecosystem, often making it an affordable and familiar place to start. Tableau is famous for its beautiful, intuitive data visualizations; you can create stunning dashboards with a simple drag-and-drop interface. Then you have platforms like Qlik, which shines with its unique associative engine that helps you find connections in your data you didn't even know you were looking for.
Making an Informed Decision
But how do you move past the big brand names? You need a practical framework. The right choice is less about the tool itself and more about your specific business context. Start by asking a few sharp questions to cut through the noise and find the perfect match.
Here are the key factors to think about:
- Team Skill Level: Do you have a team of seasoned data analysts who can write complex queries in their sleep? Or are you trying to empower business users who need a clean, simple interface? A tool with a steep learning curve will just gather dust.
- Business Size and Scale: Are you a small e-commerce startup trying to track a few core metrics? Or are you a multinational giant that needs an enterprise-level solution to manage massive datasets from dozens of sources?
- Existing Tech Stack: How smoothly will the new tool plug into your current systems, like your CRM or cloud data warehouse? You want something that integrates seamlessly to avoid data silos and technical nightmares.
- Budgetary Constraints: What can you realistically spend on licenses, implementation, and ongoing training? Costs can range from affordable monthly subscriptions to hefty enterprise-level investments.
Choosing your delivery model is also a big piece of the puzzle. Do you need a cloud-based tool, or an on-premise one? For a deeper dive on this, check out this guide on the differences between SaaS, PaaS, and IaaS.
- Actionable Insight: Don't buy a tool, solve a problem. Start by defining the top three business questions you absolutely need answers to (e.g., "Which marketing channels give us the best ROI?"). Then, work backward to find a tool that can answer them effectively within your budget and technical limits. This way, you’re investing in real business value, not just another software license.
Building Your Career in Business Intelligence
So, you've got a handle on what business intelligence is all about. The good news is that turning that understanding into an actual career is a pretty straightforward path. The field is wide open with roles that fit different personalities, whether you're someone who loves getting lost in the technical weeds or you're more excited by shaping big-picture business strategy.
The most common starting points are the BI Analyst, who acts as the crucial link between the raw data and the decision-makers, and the BI Developer, the person who builds the technical backbone—the data pipelines, warehouses, and dashboards. A little further down the road, you might find yourself as an Analytics Consultant, guiding entire organizations on how to get the most out of their data.
Core Skills for Success
To really make a mark in this field, you need a solid mix of hard and soft skills. Your technical chops will get your foot in the door, no doubt. But it's your ability to communicate and connect the dots that will propel your career forward. You have to become a master at translating complex data into a simple, powerful story.
Here’s a quick rundown of what you’ll need in your toolkit:
- Hard Skills: Proficiency in SQL is absolutely non-negotiable; it’s the language of data. You'll also need to get comfortable with at least one major BI tool like Power BI or Tableau. A good grasp of data modeling concepts is also key to organizing data in a way that actually makes sense.
- Soft Skills: Sharp critical thinking is what helps you ask the right questions of the data. Business acumen gives you the context to understand what the numbers mean for the company’s goals. And finally, data storytelling is the skill that turns your analysis into action.
Actionable Insight: An analysis that stays buried in a spreadsheet has zero value. The most successful BI professionals are those who can clearly communicate the "so what?" behind the data. Instead of saying "sales are down 5%", say "Sales are down 5%, driven by a drop in our Western region. I recommend we investigate their local marketing efforts."
Your Actionable Learning Roadmap
Ready to jump in? The best way to start is with a structured plan that builds your foundation and gives you something to show for it. We dive deep into the specific steps in this guide on how to become a data analyst.
For now, here’s a practical roadmap to get you going:
- Start with Data Literacy: Before anything else, get comfortable with the fundamentals—data types, where data comes from, and what makes it "good" or "bad".
- Master SQL: Seriously, dedicate real time to this. Becoming fluent in SQL is the single most important technical step you can take.
- Gain Tool Proficiency: Don't try to learn everything at once. Pick one major BI tool and use it to build a few projects from start to finish.
- Develop Domain Knowledge: Choose an industry that genuinely interests you, like e-commerce or healthcare, and learn its lingo, key metrics, and common challenges.
Your ultimate goal is to build a project portfolio that proves you can deliver results. When you're ready to start applying, getting tips on building a job-winning resume for a Data Analyst can make all the difference. A polished resume backed by a strong portfolio is your ticket to landing that first role.

Common Questions About BI Analytics
Let's clear up a few questions that pop up all the time when people are just getting their feet wet with business intelligence.
Do I Need to Be a Coder to Learn BI?
Not at all. While knowing some SQL is a huge plus and will definitely open more doors, you don't need a deep technical background to get started. Many of the most powerful BI tools today were built specifically for business folks, not programmers.
Think about it this way: a BI Analyst's real value often comes from understanding the business—the why behind the numbers—not just from their technical chops. You can be incredibly effective by focusing on your domain knowledge and learning how to interpret data visually.
- Actionable Insight: A good starting point is to jump into a user-friendly tool like Tableau or Microsoft Power BI. Their drag-and-drop interfaces let you build impressive dashboards right away. You can always layer in more technical skills like SQL as you go.
What's the Real Difference Between a Dashboard and a Report?
This one's simple. A dashboard is your car's dashboard. It gives you a quick, visual snapshot of your most important metrics on a single screen so you can see what's happening at a glance. It's interactive, often updated in real-time, and built for monitoring.
A report is more like the detailed diagnostic printout from your mechanic. It’s a static, in-depth document that provides the full context and analysis behind the numbers.
- Practical Example: A CEO looks at a dashboard and sees that the "Customer Satisfaction" metric is red. That's the at-a-glance insight. They then ask for a detailed report, which is a multi-page document explaining why satisfaction dropped, citing specific survey feedback and support ticket trends.
How Long Does It Take to Get a BI Solution Running?
This is the classic "it depends" answer. A small, focused project for one department using clean, ready-to-go data? You could have something up and running in a few weeks.
But if we're talking about a massive, company-wide system that needs to pull messy data from a dozen different legacy sources, you could be looking at a project that takes several months to over a year.
- Actionable Insight: The best approach is almost always to start small. Kick off a focused pilot project that solves a specific pain point, like creating a single dashboard to track marketing campaign ROI. This is the fastest way to show real value, learn lessons, and build momentum for the bigger vision.
Ready to build the skills you need for a career in data? Uplyrn offers a complete learning ecosystem with expert-led courses in business intelligence, data analytics, and more. Start your journey and unlock your potential today.


Leave your thoughts here...
All Comments
Reply